¶ STRATISYSTEM - GENERAL SYSTEM USER GUIDE - REV 4.1
Over the last 30 years, storage has evolved considerably. Initially starting as a single magnetic storage device (aka. a hard drive) with a limited amount of capacity and performance, to what we have today, which is very fast high capacity solid state disks. Additionally, the use of one individual disk expanded to include groups of disks (aka. storage arrays) working together as a whole combining their individual disk capacity and performance.
While disks and storage arrays have become more sophisticated, there still exists major deficiencies:
- Typical storage platforms only have two controllers for redundancy
- The capacity “in the box” is what you have and if you need more, you need to buy another "box"
- The performance “in the box” is what you have and if you need more, you need to buy another "box"
- All the “boxes” will reach end of life at which time you need to buy another set of "boxes", migrate all the data off, and throw the old ones out (or repurpose them for a non-production workload since support expired)
- The manufacturer who sells you “the boxes” forces you to buy their boxes with their specifications at their price
Traditional storage solutions and approaches are simply inadequate to tackle the challenges faced in today's modern IT environments. StratiSTOR is the storage platform delivering the next-generation in software-defined storage technology to meet the challenges of today, and tomorrow.
StratiSTOR is a massively scalable software-defined storage cluster, delivering enterprise-class storage services, reliability, and performance for the most demanding environments. Let's take a moment to define each of these components so the reader has a full understanding and appreciation for the technology.
¶ Massively Scalable
No defined limitations on storage capacity, node count or performance. Start with one node and scale to hundreds, start with terabytes of capacity and scale to exabytes, need 100k IOps or millions of IOps. The software will take you wherever you need to go.
¶ Software-defined
Software allows for maximum flexibility. Typically deployed on bare-metal physical hardware given its nature as a production tier-1 storage platform, it also can be deployed on any public or private cloud platform. Customers who choose to deploy in a public cloud platform are usually seeking a SAN-like experience in the cloud where performance is typically poor or unpredictable.
¶ Storage Cluster
Compared to traditional storage systems which have a finite amount of capacity, performance and redundancy, storage clusters are not subject to these limits. Clusters are made up of server nodes (or controllers) which collectively operate as a single entity and can scale vertically (aka. capacity) or horizontally (aka. controller or node count) as necessary. Traditional storage systems cannot do this because they are not designed to form a single unified architecture.
¶ Enterprise-class
Enterprise-class refers to a platform's reliability. With a storage cluster, multiple simultaneous failures can occur such as drive failures, network failures, entire node failures, even an entire site failure which will not result in an outage. Traditional storage systems cannot meet this requirement because the architecture is simply incapable of providing this level of resiliency.
¶ WHO’S USING STRATISTOR TODAY AND HOW?
StratiSTOR is being deployed by organizations of all sizes around the world. Clients with smaller requirements such as less than 50TB of capacity and less than 25,000 IOPS of performance all the way through to datacenter and bare-metal operators requiring multi-petabyte (PB) capacity and millions of IOPS of performance. There is no deployment too small or too large.
StratiSTOR is being deployed across the entire spectrum of storage use cases. Due to its nature as a pure software technology, there are no limits to where and how the technology can be deployed and utilized. Here are a few deployment examples:
¶ Bare-Metal Deployment
Used to provide tier-1 enterprise storage services in place of legacy array based SAN and NAS solutions.
¶ Public Cloud Deployment
Used to provide SAN-like experience in the cloud where storage performance is largely unpredictable due to the shared and often overcommitted nature of public cloud resources.
¶ Private Cloud Deployment
Used to provide enterprise class storage services within a local cloud environment without the need for additional hardware.
¶ Edge Deployment
Used to provide high-speed highly-available small-form-factor (SFF) deployments with technologies such as Intel NUCs, Lenovo ThinkCentre and ThinkStation, or any other SFF x86 system.
SUMMARY OF BENEFITS
| Rapid provisioning, deployment and expansion | Granular and modular rolling release refresh cycle |
| Unlimited scalability (capacity and performance) | Full API integration with other third-party platforms |
| No hardware vendor lock-in | Full comprehensive monitoring suite |
| Minimizes capital expenditure (grow as you go) | Support for hyperconvergence (VMs and container support) |
| Eliminates future capacity concerns | Supports site-to-site and stretch clustering modes |
| Non-disruptive scaling of nodes and storage capacity | No data migration needed ever again |
| Non-disruptive software upgrades | And much more… |
¶ INTRODUCTION: STRATISERV HYPERVISOR PLATFORM
Early virtualization (aka. process isolation) started as early as the 1970's and was most commonly found in large proprietary systems known as mainframes. However, it wasn't until a company named VMware in 1998 brought this technology into the mainstream in what is referred to as the “commodity x86” market (computers with either Intel or AMD processors which most people use every day). Since then, many commercial and open source organizations began work on their own virtualization engines. These engines would eventually become known as a “hypervisor”.
The introduction of this technology would mark the beginning of a revolution as big as the computer itself. But why was this so significant? Most systems in the early 2000's typically ran one operating system (i.e. Windows, Linux, etc.) and one application (i.e. web server, file server, print server, etc.). If you looked inside the operating system to track how often the system was busy, you were likely to find it was only busy 5-10% of the time. If you paid $10,000 for that system, but were only getting on average 5-10% utilization over the course of its lifetime, that's not a very good return on investment. If you take the same system and now install a hypervisor which is capable of running multiple isolated operating systems each with their own applications to get that utilization up to 50-60% or more, then you are getting your money's worth. Additionally, you also saved money from not having to purchase 3, 4 or 5 more physical servers (not to mention all money saved on your power bill and cooling costs). Virtualization just makes sense, even in its most basic form. But the story doesn't stop there.
This section is not meant to be a full history lesson in virtualization, but it is useful to set the context for the sections that follow. Once workloads became more and more virtualized, more advanced features started to emerge such as live migration and high availability to name a few among many. As time went on, more and more organizations virtualized their workloads not only to save money but to become more resilient because of these advanced features. Fast forward to today and now we have massive global service providers (aka. cloud providers) which provide these services across a global network with essentially unlimited scale and capacity.
¶ HYPERSERV: THE ULTIMATE ARCHITECTURE
StratiSTOR is first and foremost an enterprise storage system. It is a very specifically tuned platform designed for maximum performance and availability. It can serve block storage out over iSCSI and NVMeoF protocols, file storage out over SMB and NFS, and object storage out over S3 protocol.
Today's server hardware is very powerful with an abundance of CPU, memory and network connectivity, and will continue to become more so as time goes on. This means there is an opportunity to provide services beyond just storage services.
StratiSTOR supports running in a hyper-converged mode (aka. compute-over-data) simply by enabling StratiSERV (our enterprise hypervisor). This means instead of having dedicated servers running applications which get their storage from StratiSTOR, StratiSTOR can run the applications directly on top of the same hardware where StratiSTOR is running. This is referred to as HyperSERV.
HyperSERV provides both virtual machine and container support and shares the same level of high-availability as the rest of the platform. Running in hyperconverged not only reduces cost and eliminates infrastructure complexity, it can also improve performance of the applications since they are running as close to the storage as possible.
¶ RECOMMENDED DEPLOYMENT CONFIGURATIONS
Every deployment scenario has its own specific requirements and goals. For this reason the table below provides general guidelines for cluster configurations and should be considered as minimum recommended values. All values for CPU, RAM, storage, and network should take expected I/O demands and capacity into consideration. Additionally, the StratiSYSTEM operating system supports modifying the values should conditions require it.
¶ SINGLE NODE DEPLOYMENT
The StratiSYSTEM operating system supports single node deployments. This allows clients to start small and grow to any level of scale the business requires. In this scenario, the appropriate component-level redundancies are recommended. The fault domain in this deployment scenario will be at the disk level (as opposed to the node level in a standard cluster deployment).
The minimum hardware requirements for a single node deployment are as follows:
- CPU: 2x Intel/AMD processors (16c/32t). 1 thread per disk per node is recommended
- MEMORY: 128GB RAM
- DISK: Any combination of HDD/SSD/NVMe drives. No RAID controllers required.
- NETWORK: 2x 10Gb network ports (or dedicated adapters). Teaming, load-balancing, and VLAN tagged are supported. Single port is supported, but not recommended.
¶ TWO NODE DEPLOYMENT
The StratiSYSTEM operating system supports two node deployments. This allows clients to start with the minimum HA node configuration and grow to any level of scale the business requires. In this scenario, the appropriate component-level redundancies are recommended. The fault domain in this deployment scenario will be at the node level. This deployment scenario requires an external system to serve as a quorum node. This can be any small-form-factor (SFF) machine such as an Intel NUC or any public/private cloud based VM.
The minimum hardware requirements for a two node deployment are as follows:
- CPU: 2x Intel/AMD processors (16c/32t). 1 thread per disk per node is recommended
- MEMORY: 128GB RAM
- DISK: Any combination of HDD/SSD/NVMe drives. No RAID controllers required.
- NETWORK: 2x 10Gb network ports (or dedicated adapters). Teaming, load-balancing, and VLAN tagged are supported. Single port is supported, but not recommended.
¶ THREE (OR MORE) NODE DEPLOYMENT
The StratiSTOR operating system supports three or more nodes to form a fully functional highly-available cluster platform. This allows clients to achieve full service high-availability and grow to any level of scale the business requires. In this scenario, the appropriate component-level redundancies are recommended, although is not strictly required because of node level redundancy. The fault domain in this deployment scenario will be at the node level.
The minimum hardware requirements for a three (or more) node deployment are as follows:
- CPU: 2x Intel/AMD processors (16c/32t). 1 thread per disk per node is recommended
- MEMORY: 128GB RAM
- DISK: Any combination of HDD/SSD/NVMe drives. No RAID controllers required.
- NETWORK: 2x 10Gb network ports (or dedicated adapters). Teaming, load-balancing, and VLAN tagged are supported. Single port is supported, but not recommended.
¶ OTHER RESOURCE CONSIDERATIONS
If co-resident services such as virtual machine and/or container services will be enabled on the platform, then CPU, memory and network requirements should be scaled appropriately to support these additional functions.
¶ MAIN MANAGEMENT CONSOLE
¶ LOGIN PAGE
The main management console can be accessed via any standard web browser at https://[any cluster node address]:3199

NOTE: You may need to accept the certificate as the default certificate is self-signed and autogenerated at the time of installation. The certificate can be updated using the provisioning engine (see advanced configuration guide for more details).
The initial username is stratistor-admin and the password should have been provided to you by technical support.
¶ MAIN DASHBOARD
Once logged in, you are presented with the main dashboard which provides a snapshot across four different cards for the overall health of the node, CPU and memory utilization, general system information and high-level system configuration.

Each card contains a drilldown link which will provide more specific information about that respective card topic.
¶ SELECTOR
In the upper left-hand corner, you will find the server selector dropdown. This allows the administrator to toggle between different hosts within the cluster providing easy access to administrative functions for that specific host.

¶ METRICS AND HISTORY
The view metrics and history drilldown provides detailed information related to CPU, memory, disk, and network activity.

Additionally, the graphical display of the metrics can be seen at the bottom. The administrator can select the timeframe that is displayed in the graph by selecting the dropdowns located on the upper left-hand corner of the graph section.
¶ SYSTEM LOGS
The log view displays all system logs in real-time. There are various filters which can be used to narrow the log view to specific messages, event severities or event timeframes.

¶ STORAGE OPERATIONS
On the storage view, the administrator can see the real-time performance metrics for all storage related activity within a selectable time window. All known storage devices will be displayed in the lower pane along with real-time storage related logging.

The action button in the upper right-hand corner of the storage device pane allows the administrator to perform functions such as mapping NFS volumes, creating LVM volumes, attaching iSCSI disks, and much more.
You can also perform individual disk operations such as mounting, formatting, shrinking, growing, deactivating and deleting disk objects.
¶ NETWORK OPERATIONS
On the network view, the administrator can see the real-time performance metrics for all network related activity within a selectable time window. All known network interfaces will be displayed in the lower pane along with real-time network related logging.

From this view, the administrator can modify existing network interface configurations and create new network devices such as VPNs, bonds and teams, bridges (aka. virtual switches), and VLANs.
Additionally, if required, the firewall services can be enabled and rules defined.
¶ NETWORK OPERATIONS (VPN)
If VPN services are required, the administrator can use the native WireGuard VPN capability to establish point-to-point secure high-speed interconnects with other WireGuard systems anywhere in the world over any routable network (see advanced configuration guide for more details).

¶ NETWORK OPERATIONS (NETWORK BONDING/TEAMING)
If network bonding is required, the administrator can create bonds with two or more interface adapters such as round robin, active backup, XOR, Broadcast, 802.3ad Etherchannel LACP, adaptive transmit load balancing, and general adaptive load balancing. For more information related to advanced network bonding techniques, see the advanced configuration guide for more details.

NOTE: Bonding should be used in place of teaming as teaming is deprecated and will be removed in future releases.
¶ NETWORK OPERATIONS (BRIDGING)
Every StratiSYSTEM includes at least one initial bridge (usually br0). The bridge forms the virtual switch with the main front-end network interface to allow any resident virtual machines to communicate with the local area network (LAN). Do not remove this bridge as it is needed for proper cluster network operations.

Additional bridges can be created as necessary for any and all unused network interfaces available on the node. For more information related to advanced bridging techniques, see the advanced configuration guide for more details.
¶ NETWORK OPERATIONS (VLAN)
If the node is connected to a network which utilizes network trunking, VLANs can be created in order to communicate with specific layer-2 VLAN segments. When a VLAN is created, the system creates a new virtual network adapter which is tagged to the specified VLAN ID. This can be used directly or further attached to a bridge allowing multiple devices to use the VLAN interface.

To configure the VLAN, specify the parent network interface, VLAN ID and name of the VLAN. For more information related to trunks and VLANs, see the advanced configuration guide for more details.
¶ NETWORK OPERATIONS (FIREWALL)
If you require a firewall configuration, the firewall service can be enabled and rules defined on a per cluster node basis.

The first step is to unmask the firewall service in the Services View (from the left pane). Find the firewalld service and using the action button (┆), select Allow running (unmask). Now return to the Networking View and you can now enable/disable the firewall service.
Once enabled, you will be able to add/modify zones and add/delete services for your specific configuration requirements.


¶ VIRTUAL MACHINES
If virtual machine services are enabled on the cluster, you will have a Virtual Machine view listed in the pane on the left (along with a StratiSERV view, which we will cover in more detail later in this guide).

The virtual machines view provides access to all virtual machine related functions such as creating, configuring and operating virtual machines.
¶ VIRTUAL MACHINES (STORAGE POOLS)
When first creating a virtual machine, you must define at least one virtual disk for the virtual machine to use as the base operating system disk. You can also allocate additional disks as necessary for each virtual machine.

The first step is to open the Storage Pools view within the Virtual Machines view. This is located at the top of the Virtual Machines view pane. From here, you will see all available storage pools present on the node.
If you are running virtual machine services along with StratiSTOR storage services, you should see at least one storage pool named “machines”. If you are running StratiSERV independent of StratiSTOR, a default storage pool may be the only one listed. You can create additional storage pools from any available on-prem storage devices including SMB, NFS, iSCSI, NVMeoF, and Fibre-channel based storage devices.
¶ VIRTUAL MACHINES (STORAGE POOLS)
For this example, we will select the machines storage pool and then select the Storage Volume tab to see all available virtual disk images present within the storage pool.

¶ VIRTUAL MACHINES (CREATE STORAGE VOLUMES)
The next step is to create a storage volume to be used at the underlying virtual disk image for the virtual machine. Provide the name and size for the storage volume. Leave the format selection as QCOW2 (this is the modern disk image format used by StratiSERV).

When ready, click on CREATE to create the storage volume.
¶ VIRTUAL MACHINES (CREATE VIRTUAL MACHINE)
The next step is to create the virtual machine. To do this, click on the Virtual Machines link at the top of the storage pools pane (or click on Virtual Machine view in the far left pane). Now click on the CREATE VM button on the far right side of the virtual machines view.

The Create Virtual Machine wizard will appear. From this view, provide a name for the machine, installation type (download from online repo and local install media (ISO) are the two most common), the operating system type (which should be auto-detected), storage location (select the machines storage pool), the volume (which is the virtual storage volume you created in the previous step), and the memory allocation.
When ready click on Create and Edit. This will allow for further configuration prior to starting the virtual machine.
¶ VIRTUAL MACHINES (IMPORT VIRTUAL MACHINE)
Rather than creating a new virtual machine, if you need to import a QCOW2 or RAW virtual machine image from a foreign system, you can perform this by clicking on the IMPORT VM button from the Virtual Machine pane.

Here you will be presented with the Import Virtual Machine wizard. The storage and related virtual machine image must be accessible on the local node in order to properly import an existing virtual machine.
¶ VIRTUAL MACHINES (MODIFY VIRTUAL MACHINE)
Immediately following the creation of a new virtual machine or if you are modifying an existing virtual machine, the virtual machine details view will be shown as seen below.

This will allow the administrator to modify the existing virtual machine configuration for items such as CPU, memory, disk and network.
NOTE: If you are modifying a running virtual machine, some changes require a power down/reboot before the changes can take effect. The interface will indicate this as necessary.
¶ VIRTUAL MACHINES (MODIFY VIRTUAL MACHINE MEMORY)
To change the memory allocation for a specific VM, click on the EDIT link next to the Memory field in the VM overview pane. From here you will be presented with current and maximum memory values allocated to this VM.

Current is representative of the minimum amount of memory the VM is operating with and the maximum memory allocation is the maximum amount of memory the VM can consume.
¶ VIRTUAL MACHINES (MODIFY VIRTUAL MACHINE CPU)
To change the CPU configuration for a specific VM, click on the EDIT link next to the CPU field in the VM overview pane. From here you will be presented with vCPU maximum allocated value, the current vCPU count (not to exceed the maximum value), the number of sockets, cores per socket, and threads per core the vCPU should be configured with. The standard configuration is to allocate a single socket and the core per socket to match the number of vCPUs defined above.

NOTE: You may need to adjust these vCPU settings to be compliant with specific software licensing requirements within the VM.
¶ VIRTUAL MACHINES (MODIFY VIRTUAL MACHINE WATCHDOG)
The VM watchdog is a service which monitors the liveliness state of the VM. If the hypervisor detects that the VM has become unresponsive for any reason, the hypervisor will take this action in an attempt to restore the VM back to an operational state.

NOTE: This feature requires that the virtio tools are installed. Linux machines include these tools in the standard repo. For Windows machines, the virtio-tools.iso is located in the machines storage pool under ISOs.
If you need to download the tools manually, the link to the latest version is located here.
¶ VIRTUAL MACHINES (MODIFY VIRTUAL MACHINE VSOCK)
The Vck feature is a special communications capability that allows the guest VM to communicate directly with the underlying hypervisor host.

NOTE: This feature requires vsock compatible tools such as socat installed in the guest to facilitate the communications channel between the guest and the host.
¶ VIRTUAL MACHINES (MODIFY VIRTUAL MACHINE DISKS)
Within the Virtual Machine overview pane, the administrator can modify the virtual disk configuration for a specific VM. Add and Edit functions are available in the Disk section of this pane.
¶ VIRTUAL MACHINES (ADD VIRTUAL MACHINE DISKS)
To add a virtual disk image to this virtual machine, click on the ADD DISK button. This will display the Add Disk wizard view. Select Create New. Provide the storage pool, name, size, and format for the new virtual volume. Optionally, you can define the cache mode and bus. Generally the default settings will be appropriate for new disk volumes.

NOTE: For Windows based VMs, you must have the bus type set to SATA in order for the Window installer to detect the virtual disk during installation. For Linux VMs, this can be set to VIRTIO as the drivers are already present within Linux operating systems.
¶ VIRTUAL MACHINES (ADD VIRTUAL MACHINE NETWORKS)
To add a virtual network to this virtual machine, click on the ADD NETWORK INTERFACE button. For typical configurations, select Bridge To LAN as the interface type, then the br0 device, and finally the driver model for the virtual interface.

NOTE: For Windows based machines, until the virtio-tools are installed, you must use the E1000 type model. After the tools are installed you can change to the higher performing VIRTIO model. For Linux based machines, you can use VIRTIO immediately as the drivers are already present.
¶ VIRTUAL MACHINES (ADD VIRTUAL MACHINE HOST DEVICE PASSTHROUGH)
If you have specialized hardware that needs to be dedicated to the guest VM, you can add a host device by clicking on the ADD HOST DEVICE button. You will be presented with USB and PCI based devices which can be mapped directly through to the guest VM.

NOTE: Any devices mapped to the guest VM will be inaccessible by the host machine. Multiple devices may need to be mapped depending on the device selected. Please see the specific hardware manufacturer recommendations for how to properly perform this function.
¶ VIRTUAL MACHINES (ADD VIRTUAL MACHINE SNAPSHOT)
Virtual machine snapshots are a powerful feature which allows an administrator to rollback to a previous point in time in the event a change was made within the VM and needs to be reverted.

To perform a snapshot, the VM can be offline or running. Provide the name and description of the snapshot. If the VM is online, you will also need to specify the memory state path (which should default to the location where the VM is running). When ready, click on CREATE.
It may take a moment to save the memory state to the disk, but the VM is usable during this time.
To revert to a previous snapshot state, simply click on REVERT
To delete a snapshot state, simply click on DELETE
¶ STRATISERV CLUSTER MANAGER (HOSTS AND VMS)
If you have deployed HyperSERV (StratiSTOR with StratiSERV) or just StratiSERV by itself, you will see the StratiSERV virtual cluster management options in the far left menu pane.
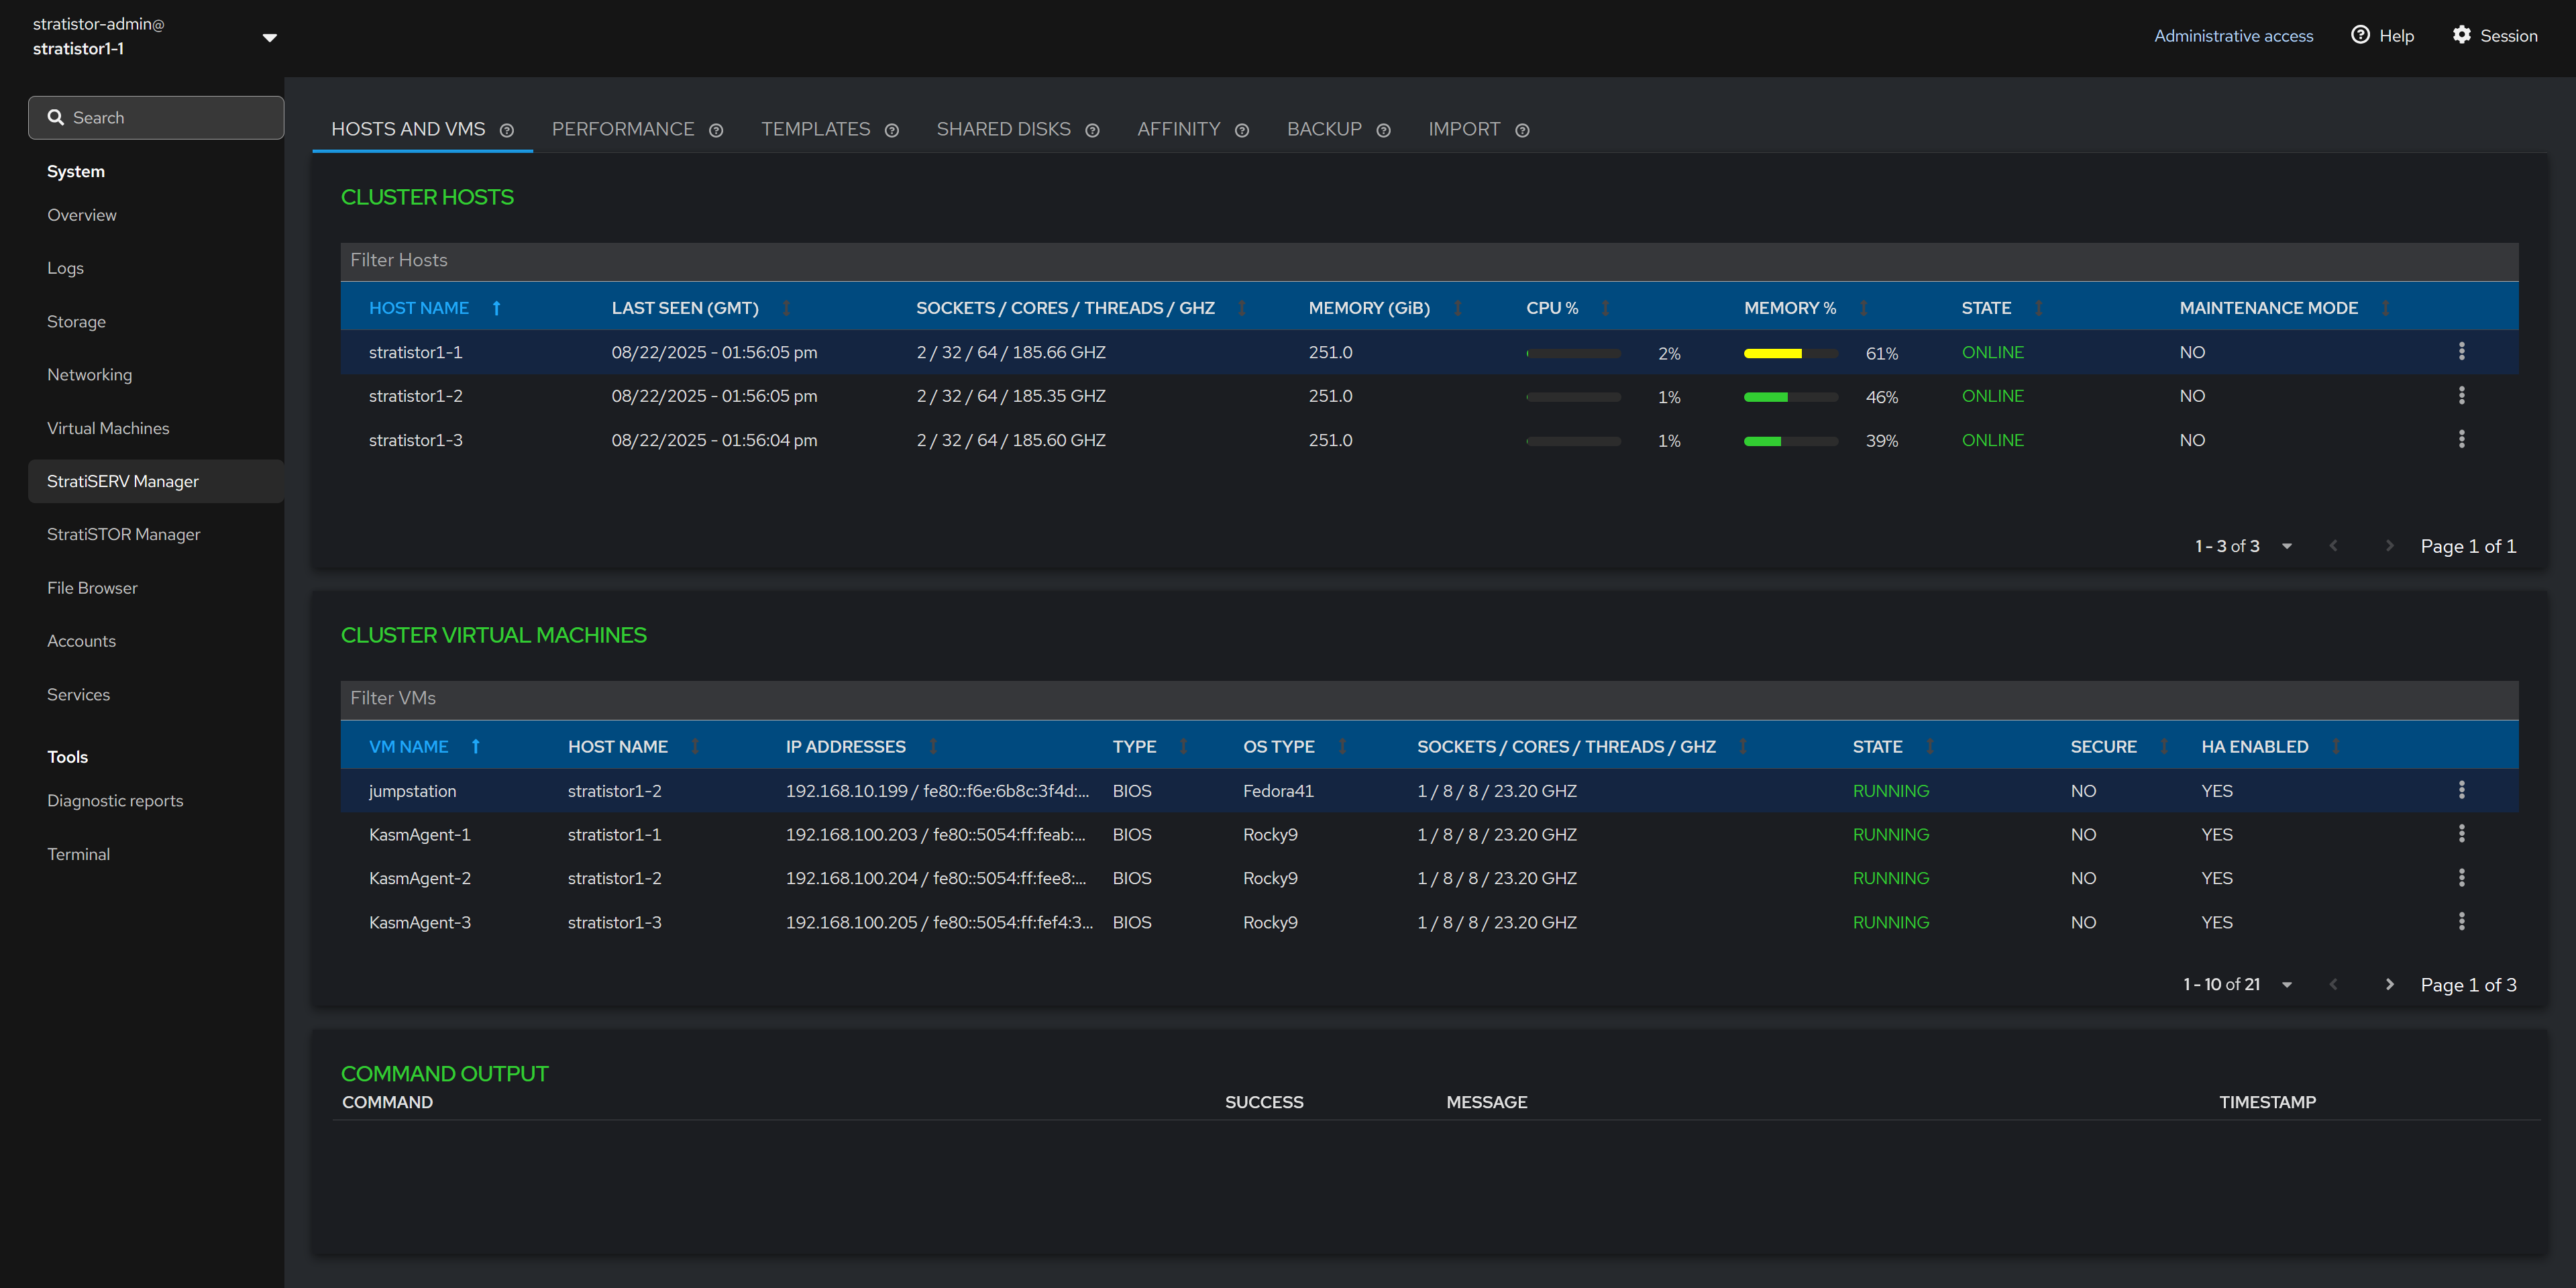
This management plugin provides access to all necessary virtual machine and container clustering support operations.
The main Hosts and VMs view shows the current state of all hosts and virtual machines in the cluster.
NOTE: If StratiSERV is the only service installed, you will see an additional info icon next to the CLUSTER HOSTS title used for opening the license manager.
¶ HOSTS AND VMS - MAINTENANCE MODE
The Cluster Hosts table can be used to perform host based operations such as entering and exiting maintenance mode.
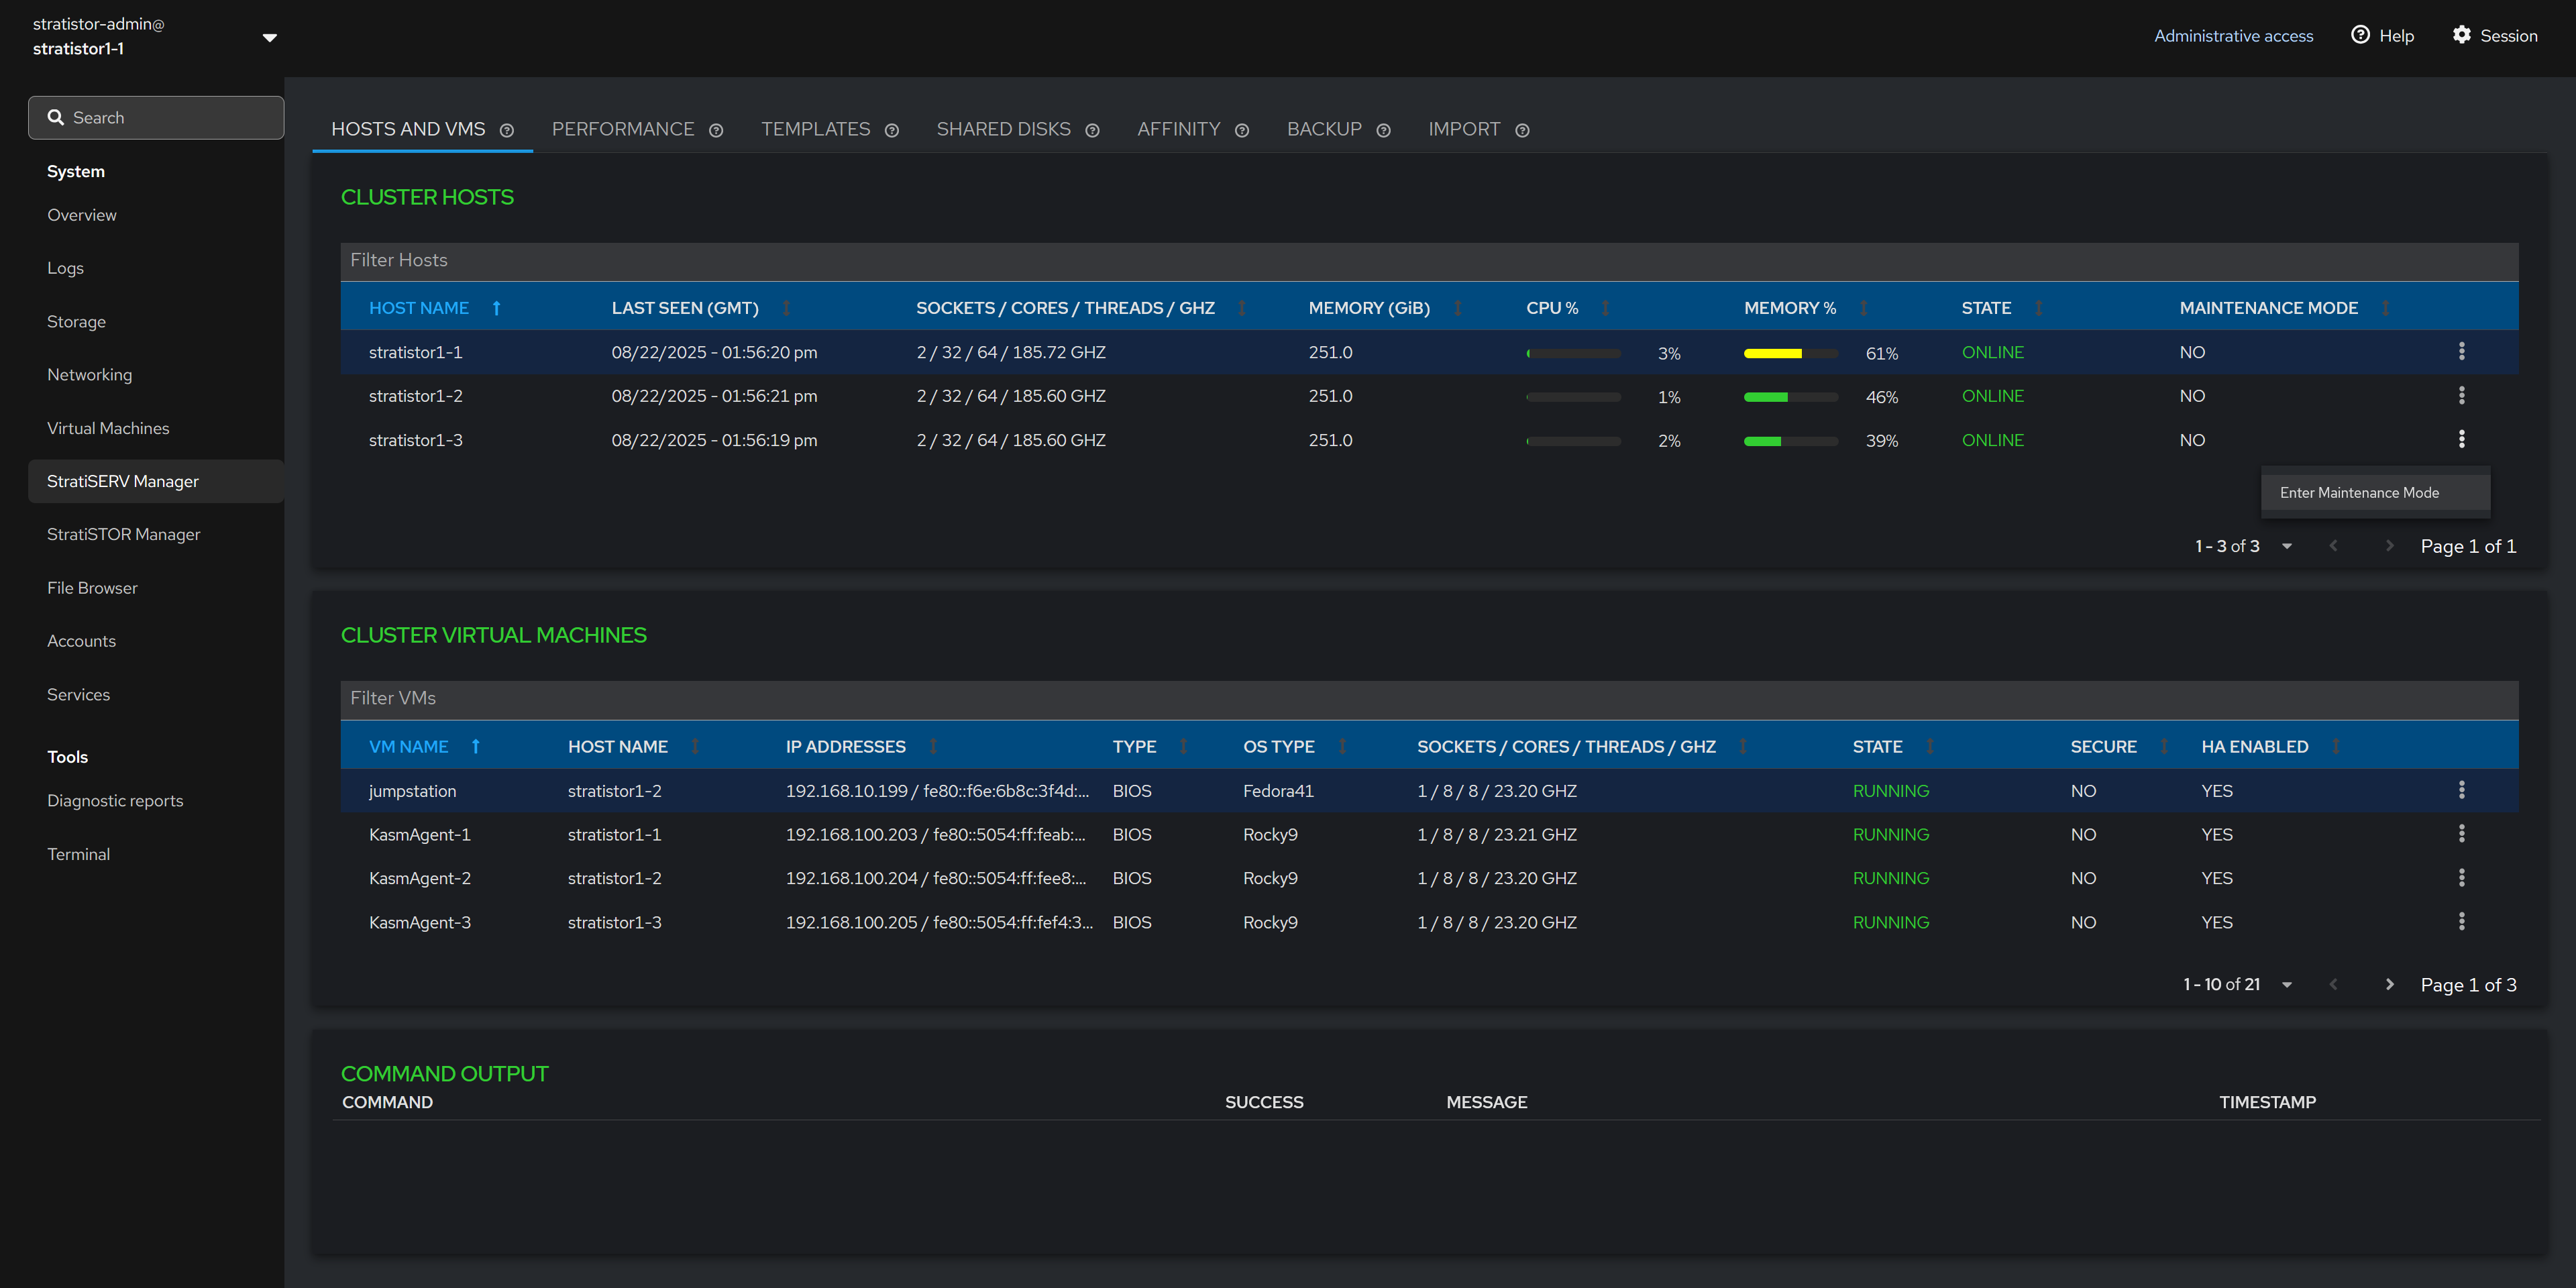
The view can be filtered using the filter line located just above the host table on the left side of the pane.
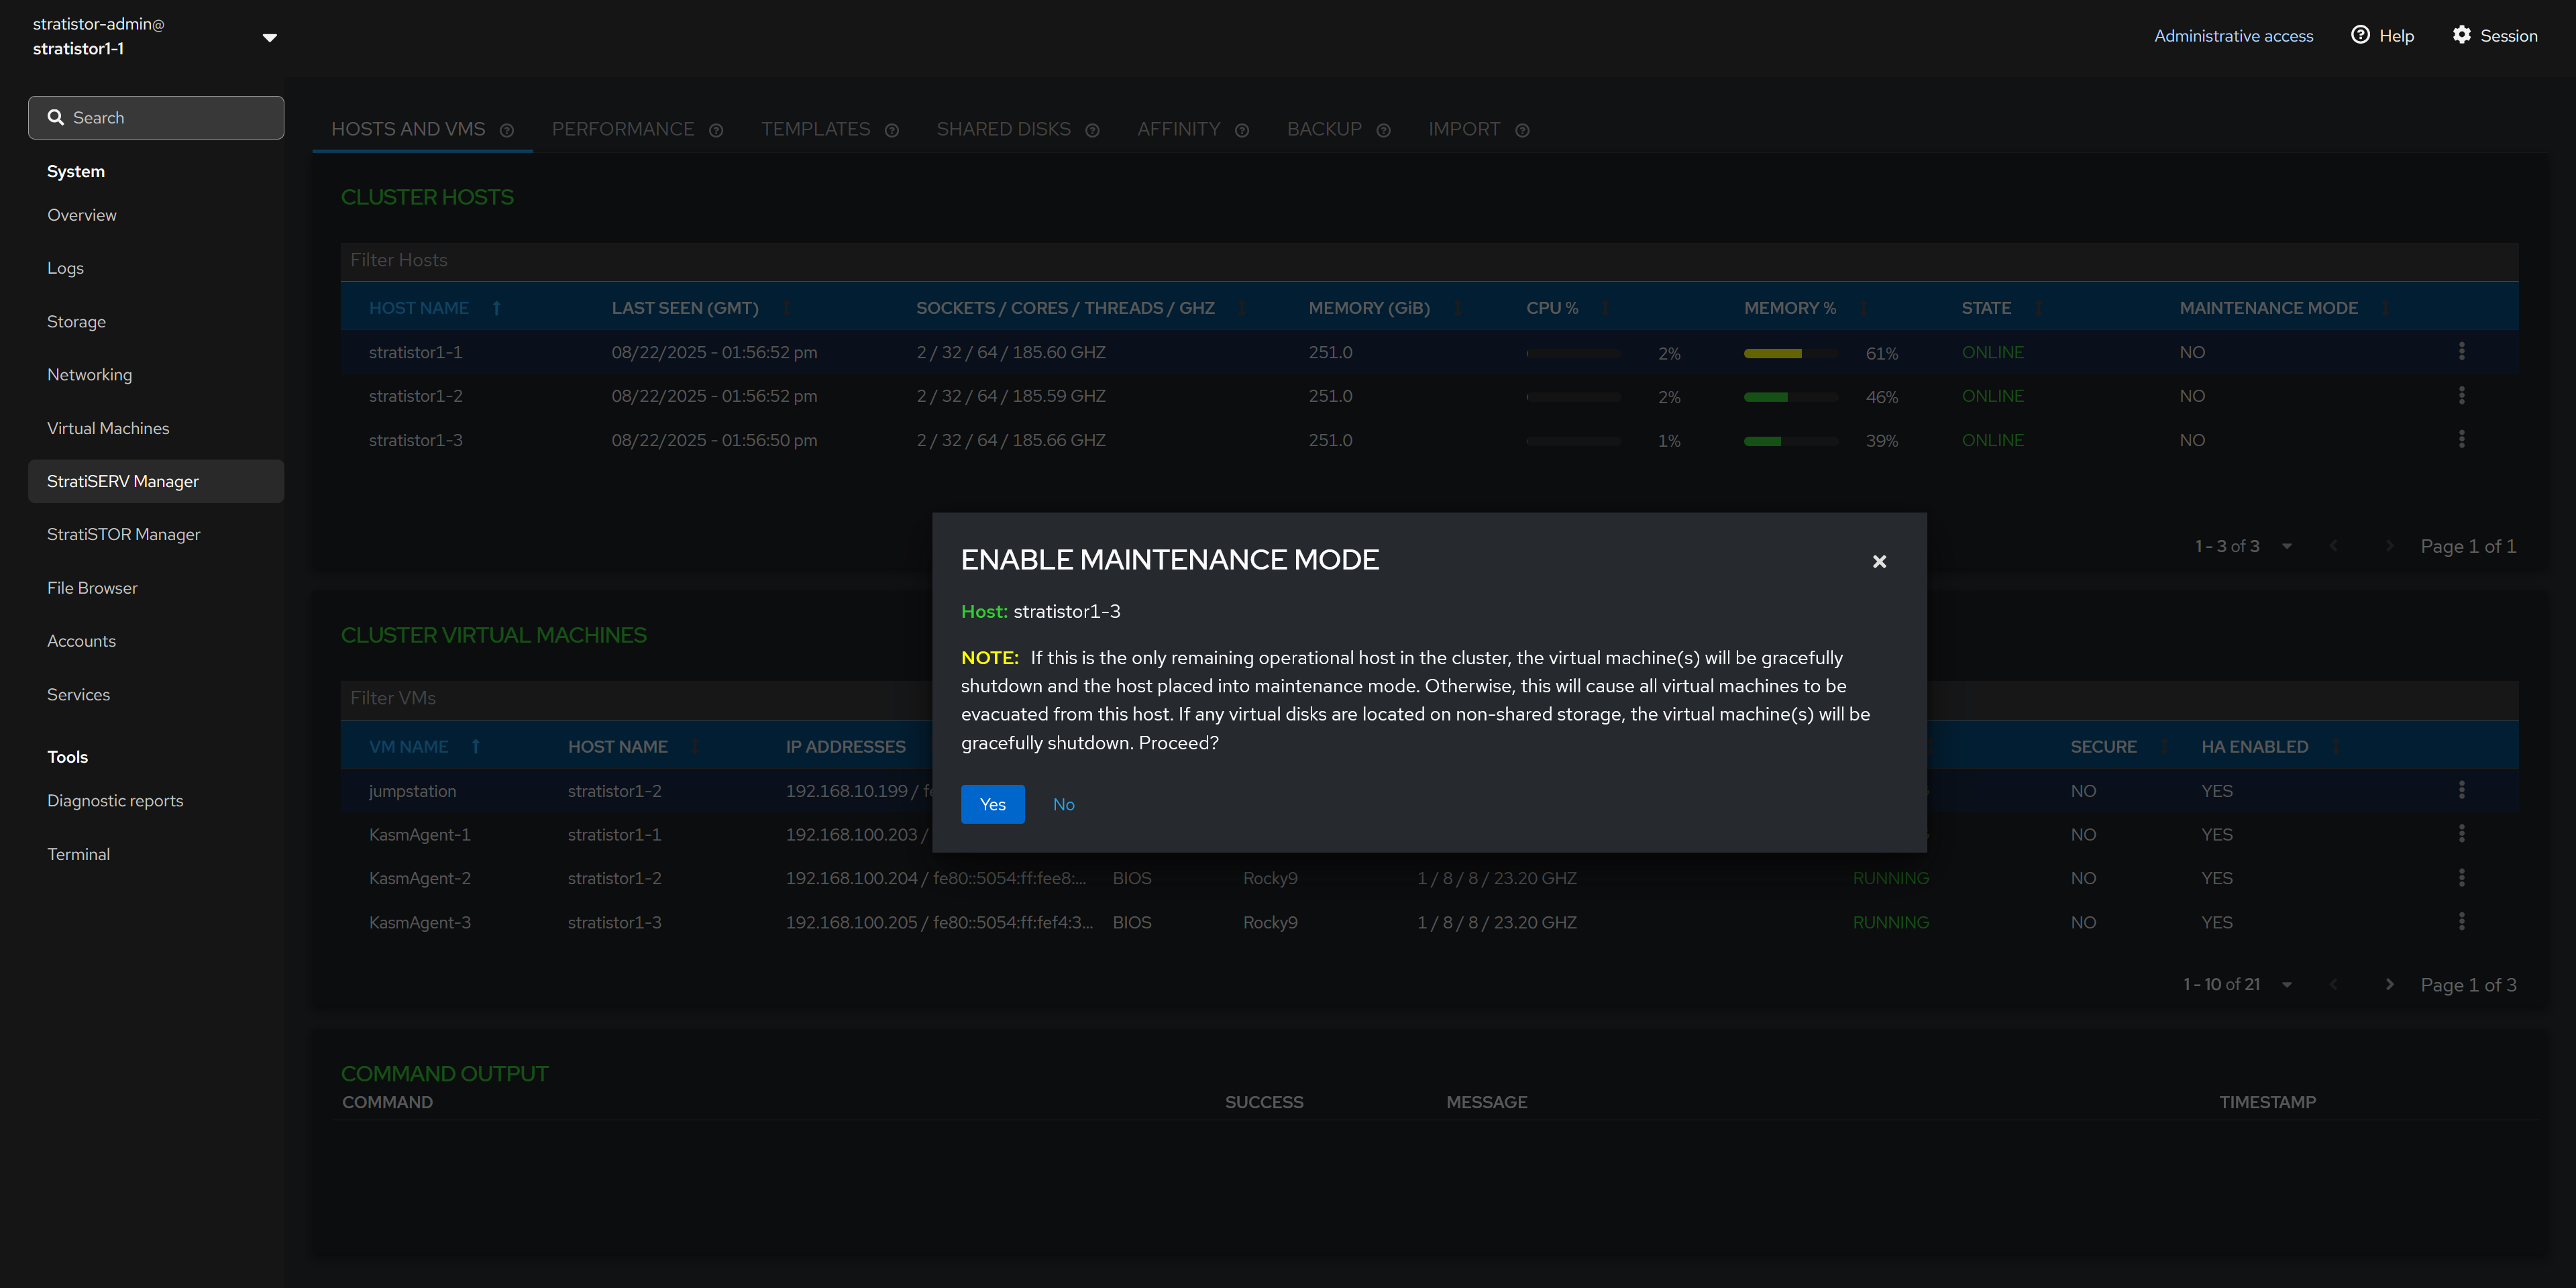
¶ HOSTS AND VMS - MAINTENANCE MODE
To place a host into maintenance mode, simply click on the hosts’ action button (┆), and select Enter Maintenance Mode. If the host is already in maintenance mode, you will be presented with the option to Exit Maintenance Mode.
When entering maintenance mode, the hypervisor will evacuate all VMs from the host to remaining hosts within the cluster. If there are no available hosts to migrate to, the hypervisor will perform a graceful shutdown attempt on the running VMs.
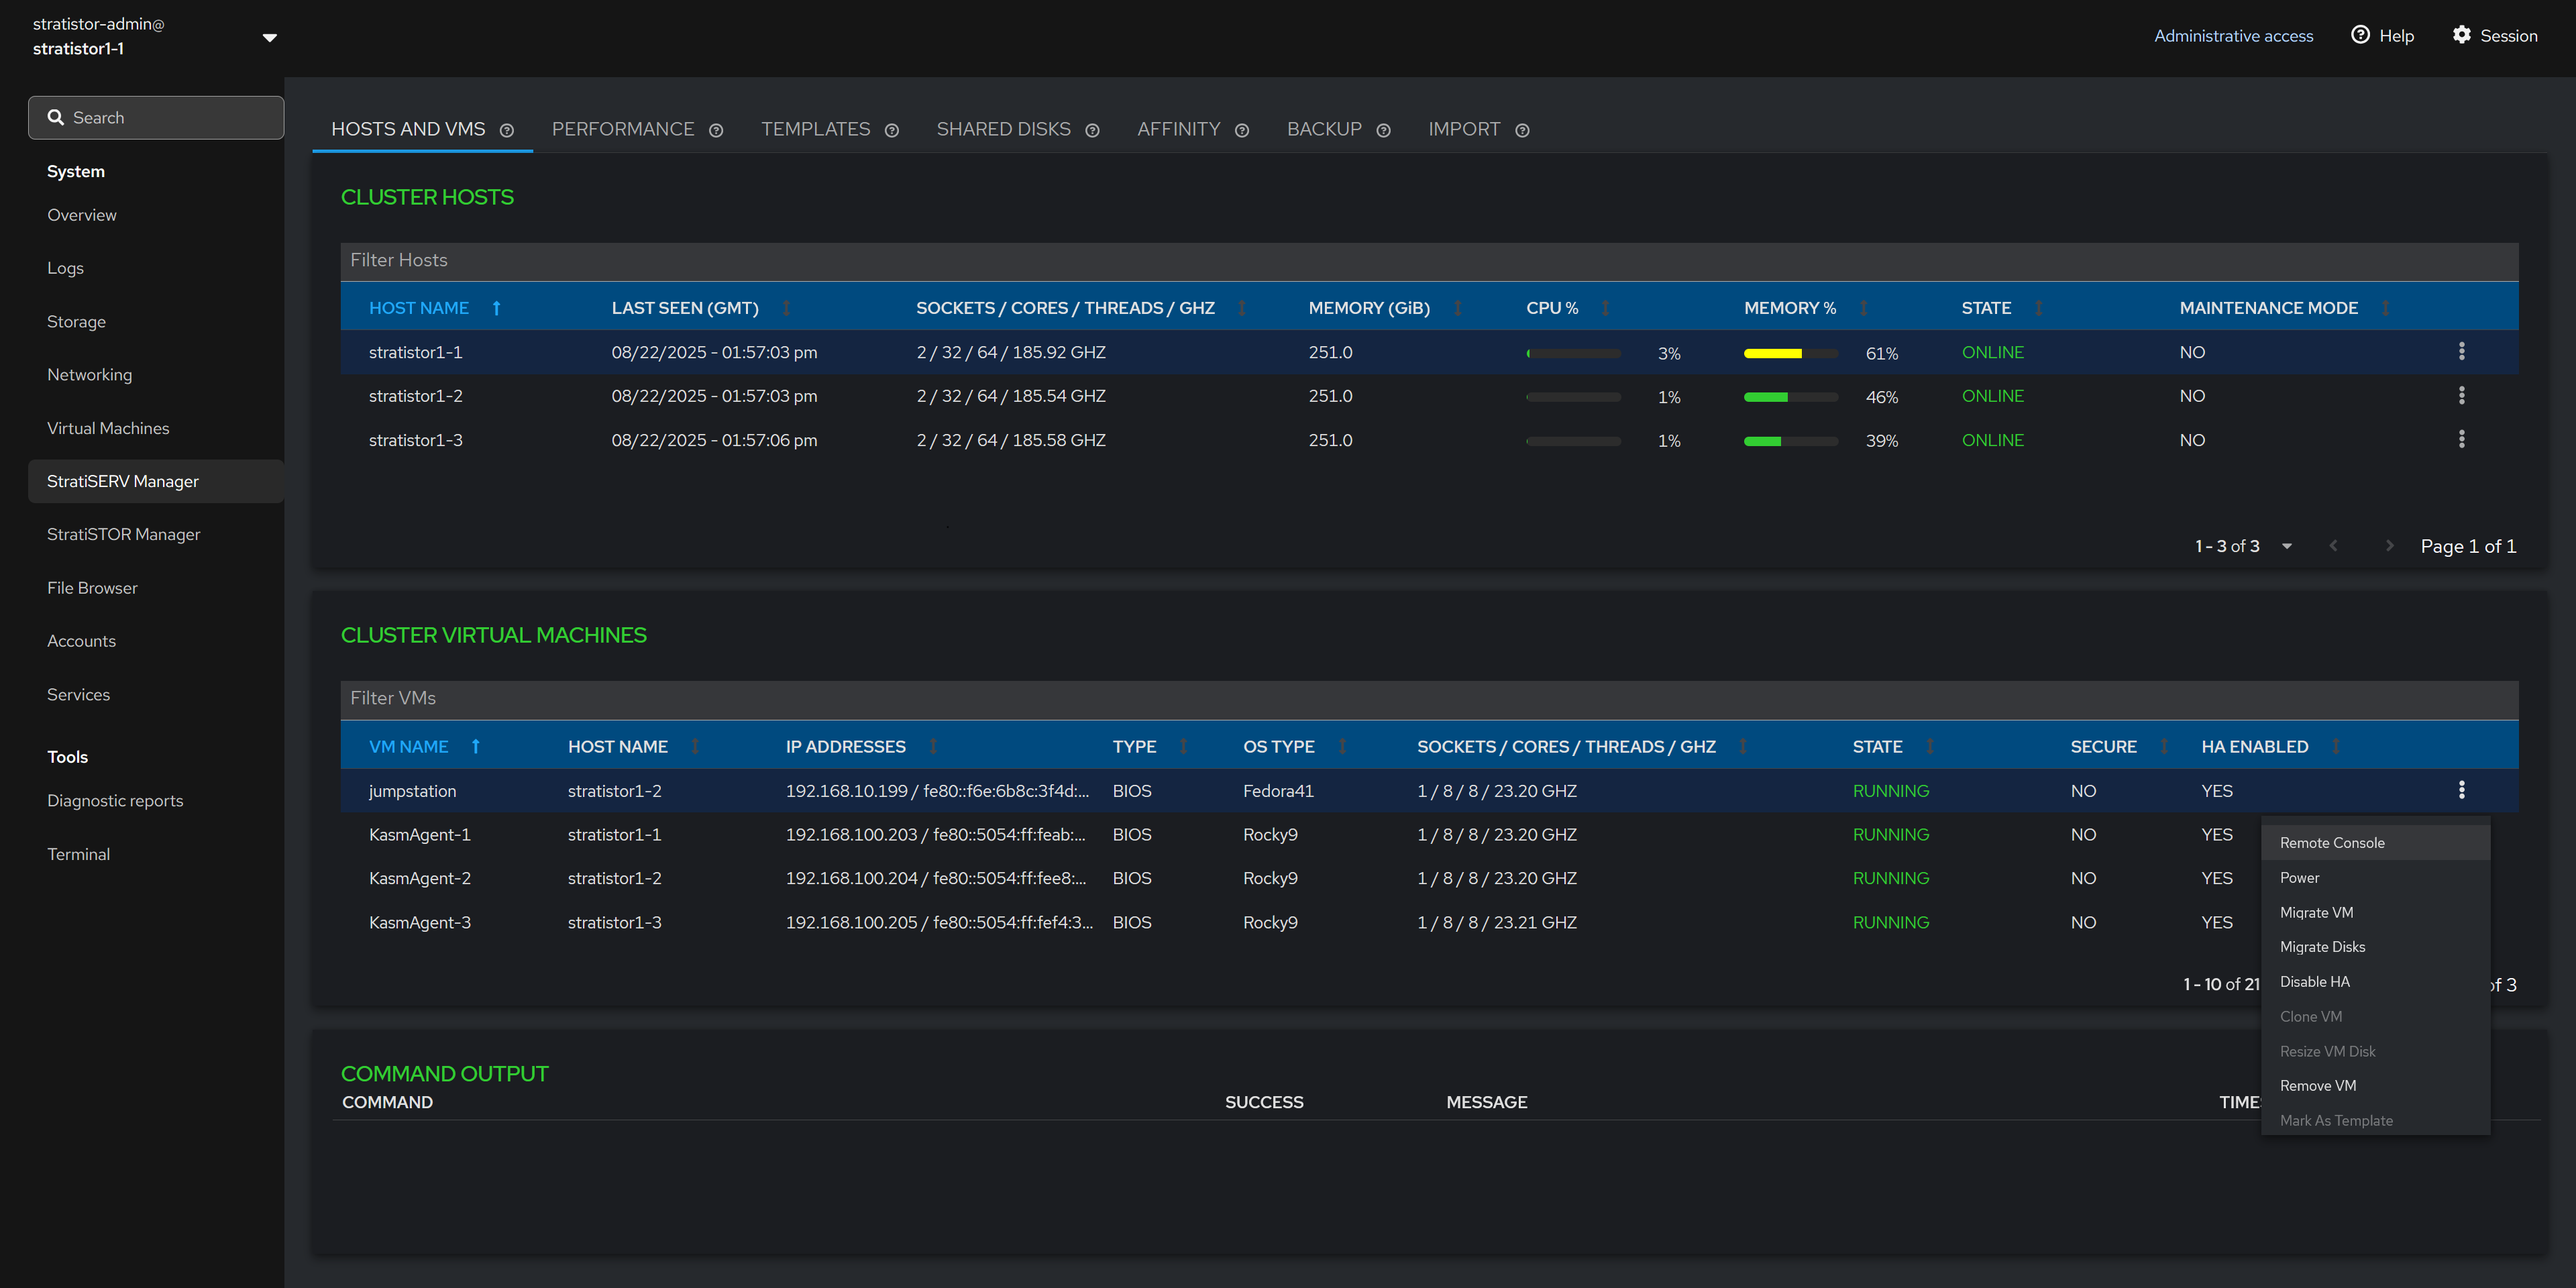
¶ HOSTS AND VMS - VM FUNCTIONS
The Cluster Virtual Machines table can be used to perform VM based operations such as opening a remote console (to a running VM), performing power functions, live migrating a VM, live storage migrating a VM, enabling/disabling HA mode, cloning a VM, resizing a VM disk, removing/deleting a VM from inventory, marking a VM as a template, and editing additional settings.
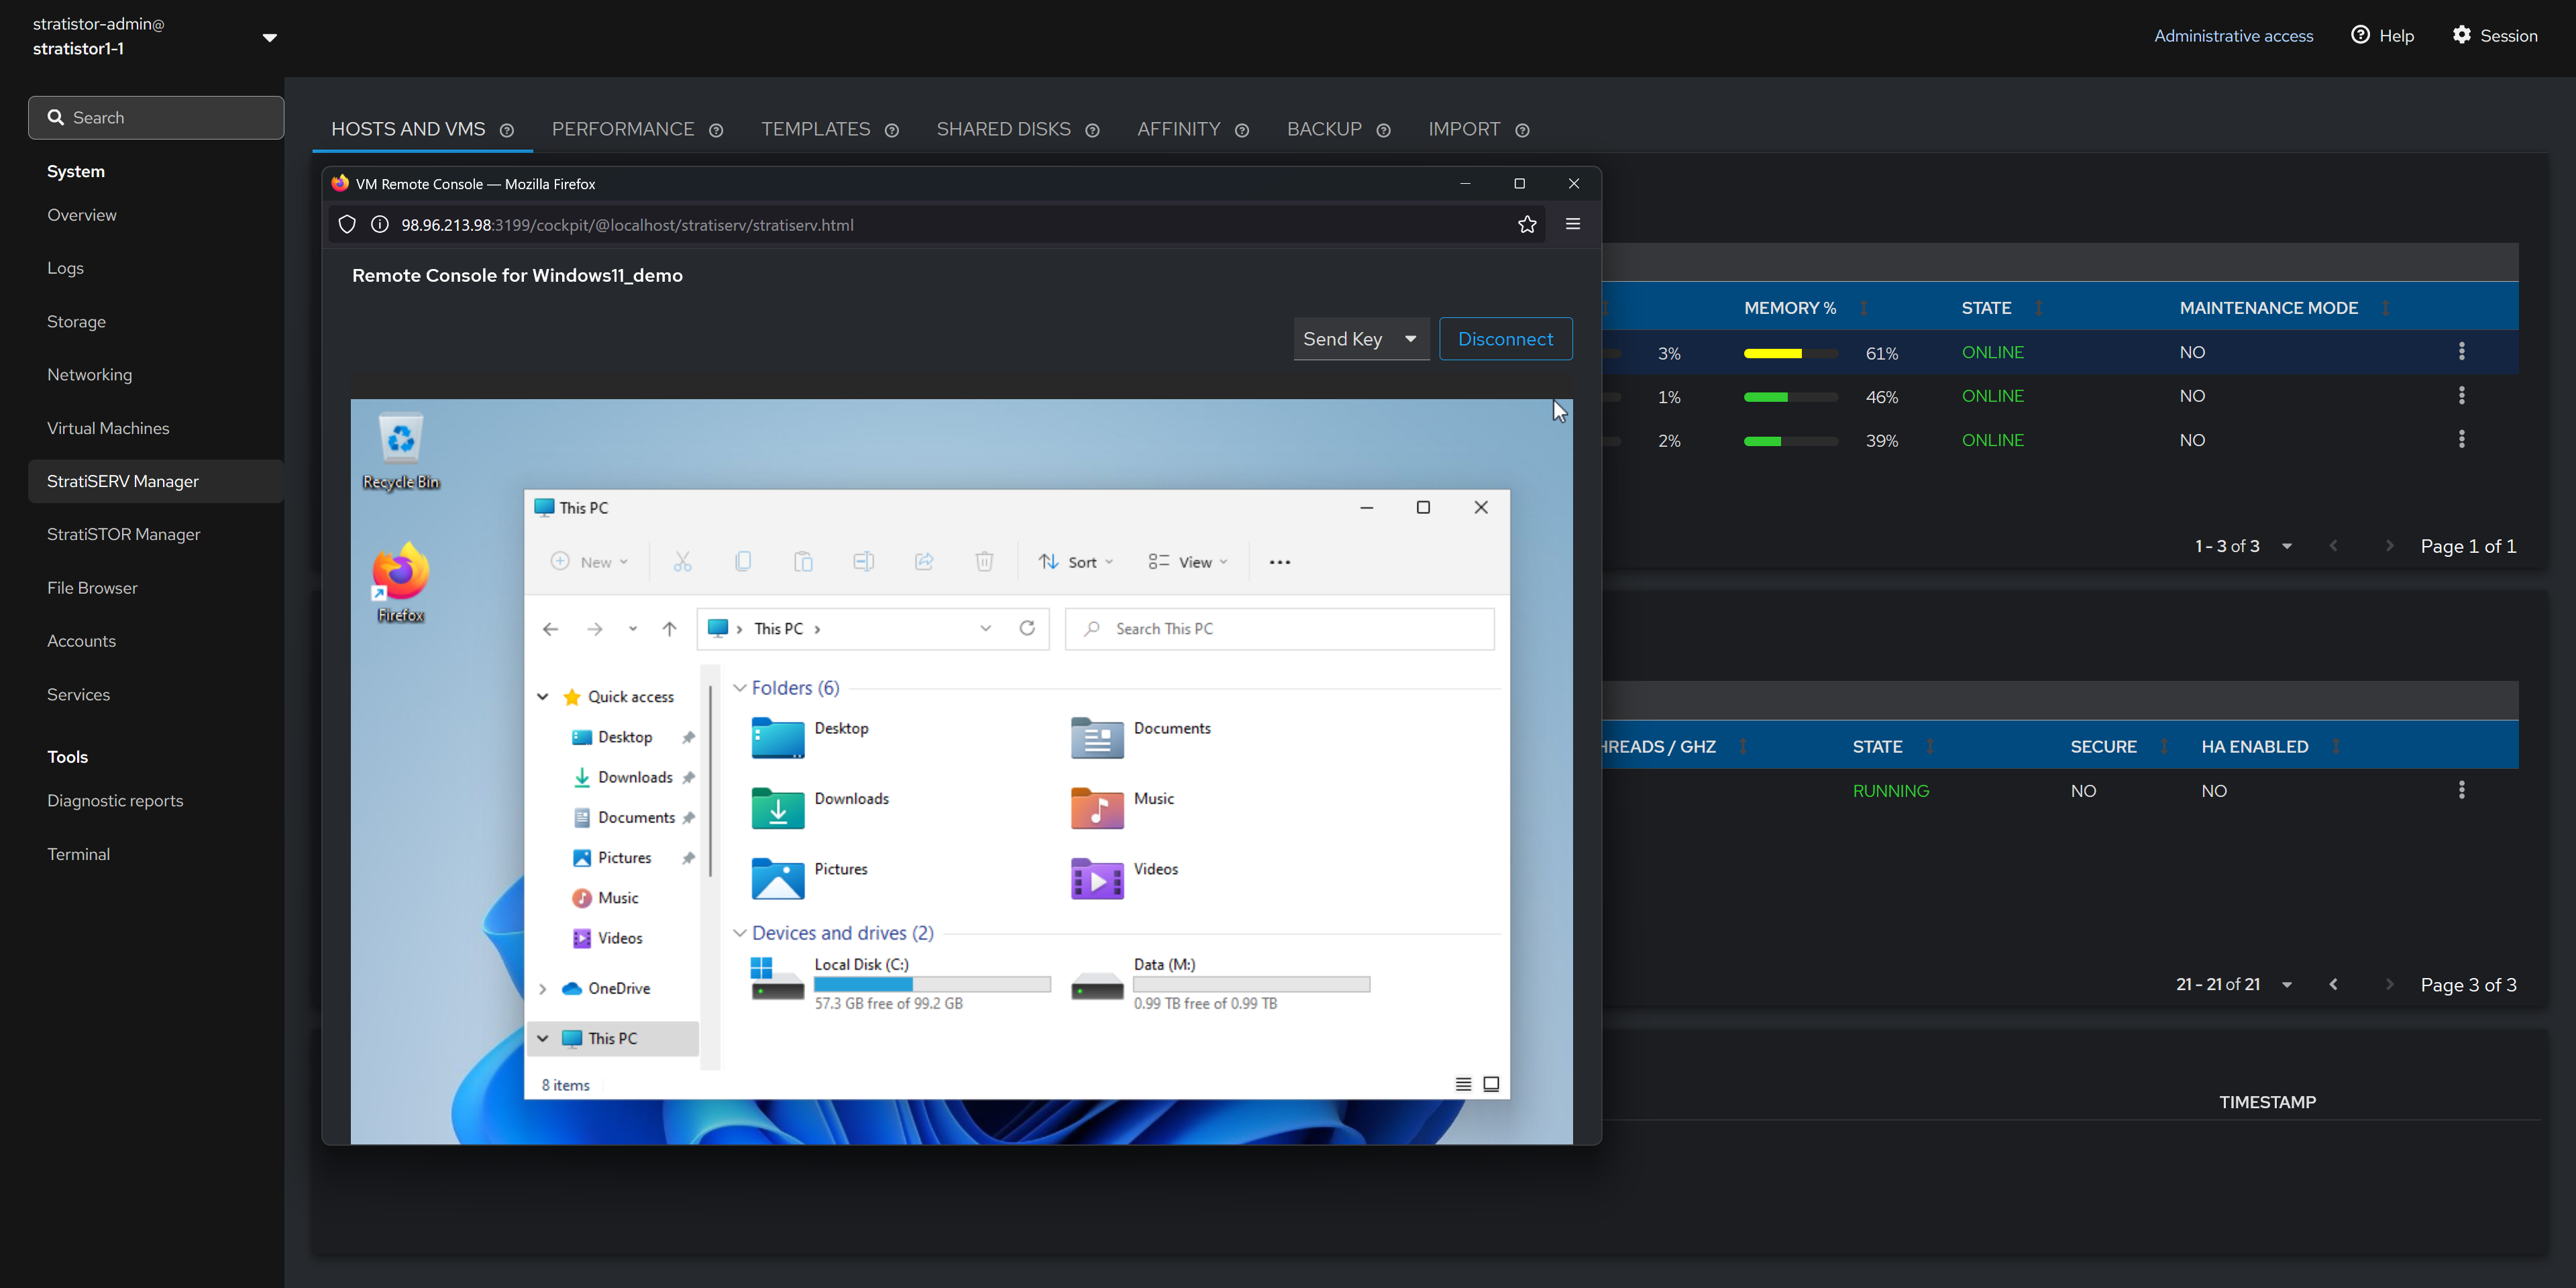
¶ HOSTS AND VMS - REMOTE CONSOLE
The remote console feature is a break-out window that provides the administrator with console access to the running virtual machine.
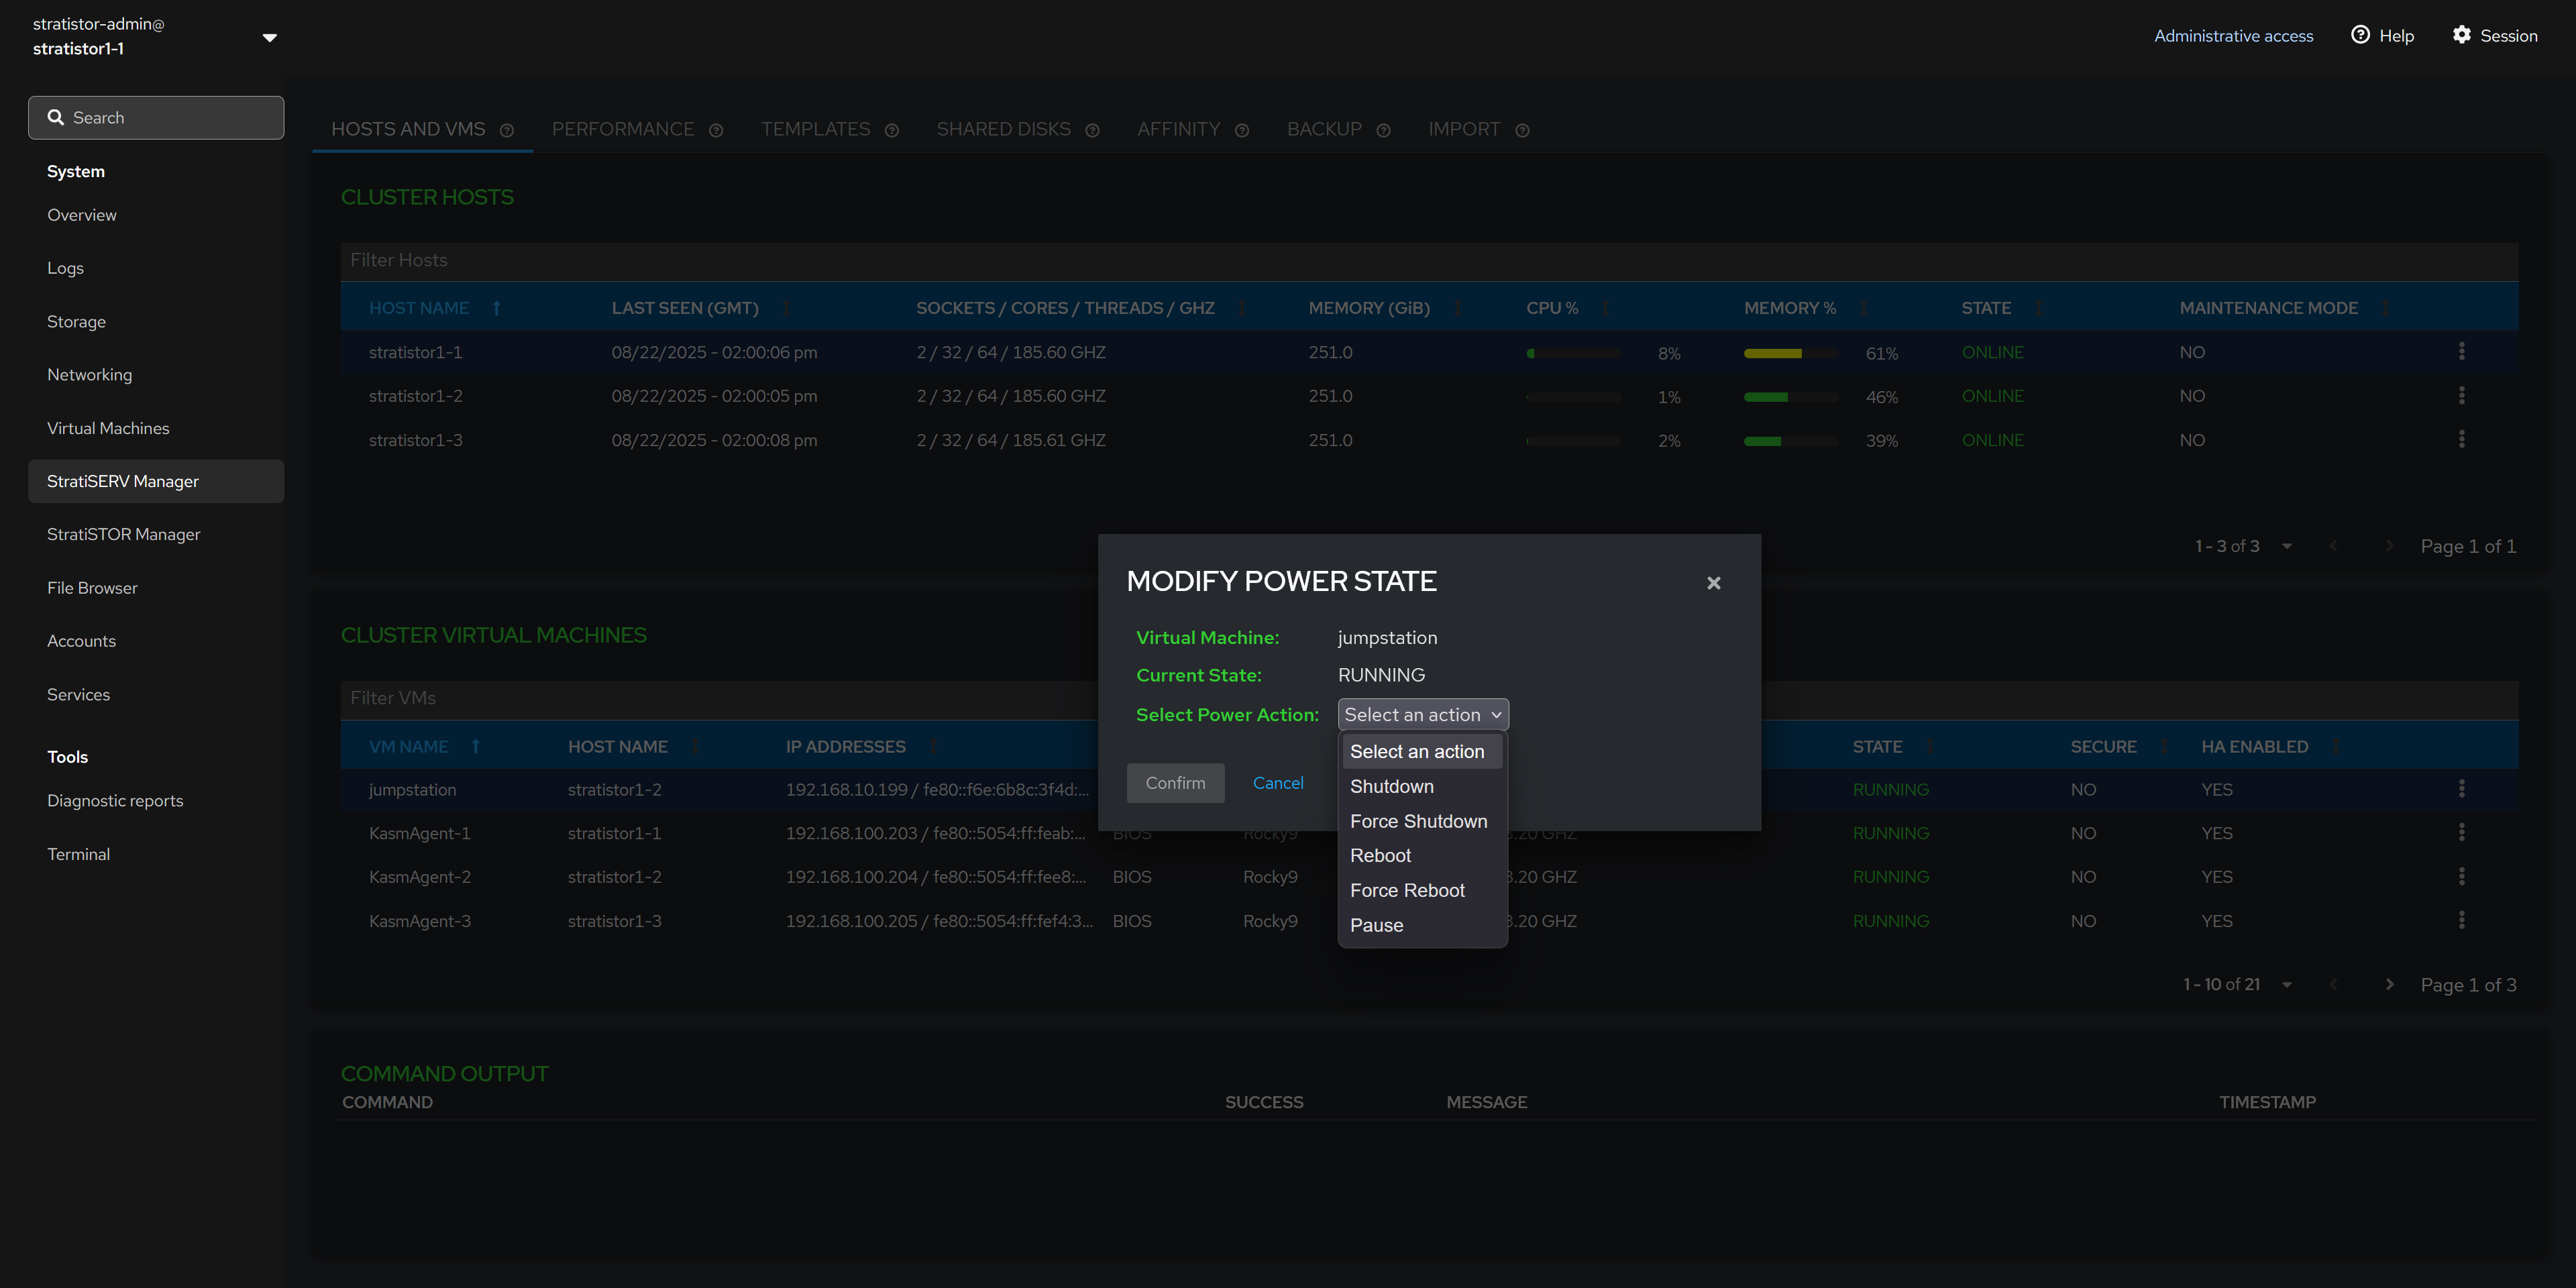
¶ HOSTS AND VMS - POWER FUNCTIONS
To modify the power state of the VM, select the appropriate power function from the list of options. The list will always reflect the options available based on the current power state of the VM.
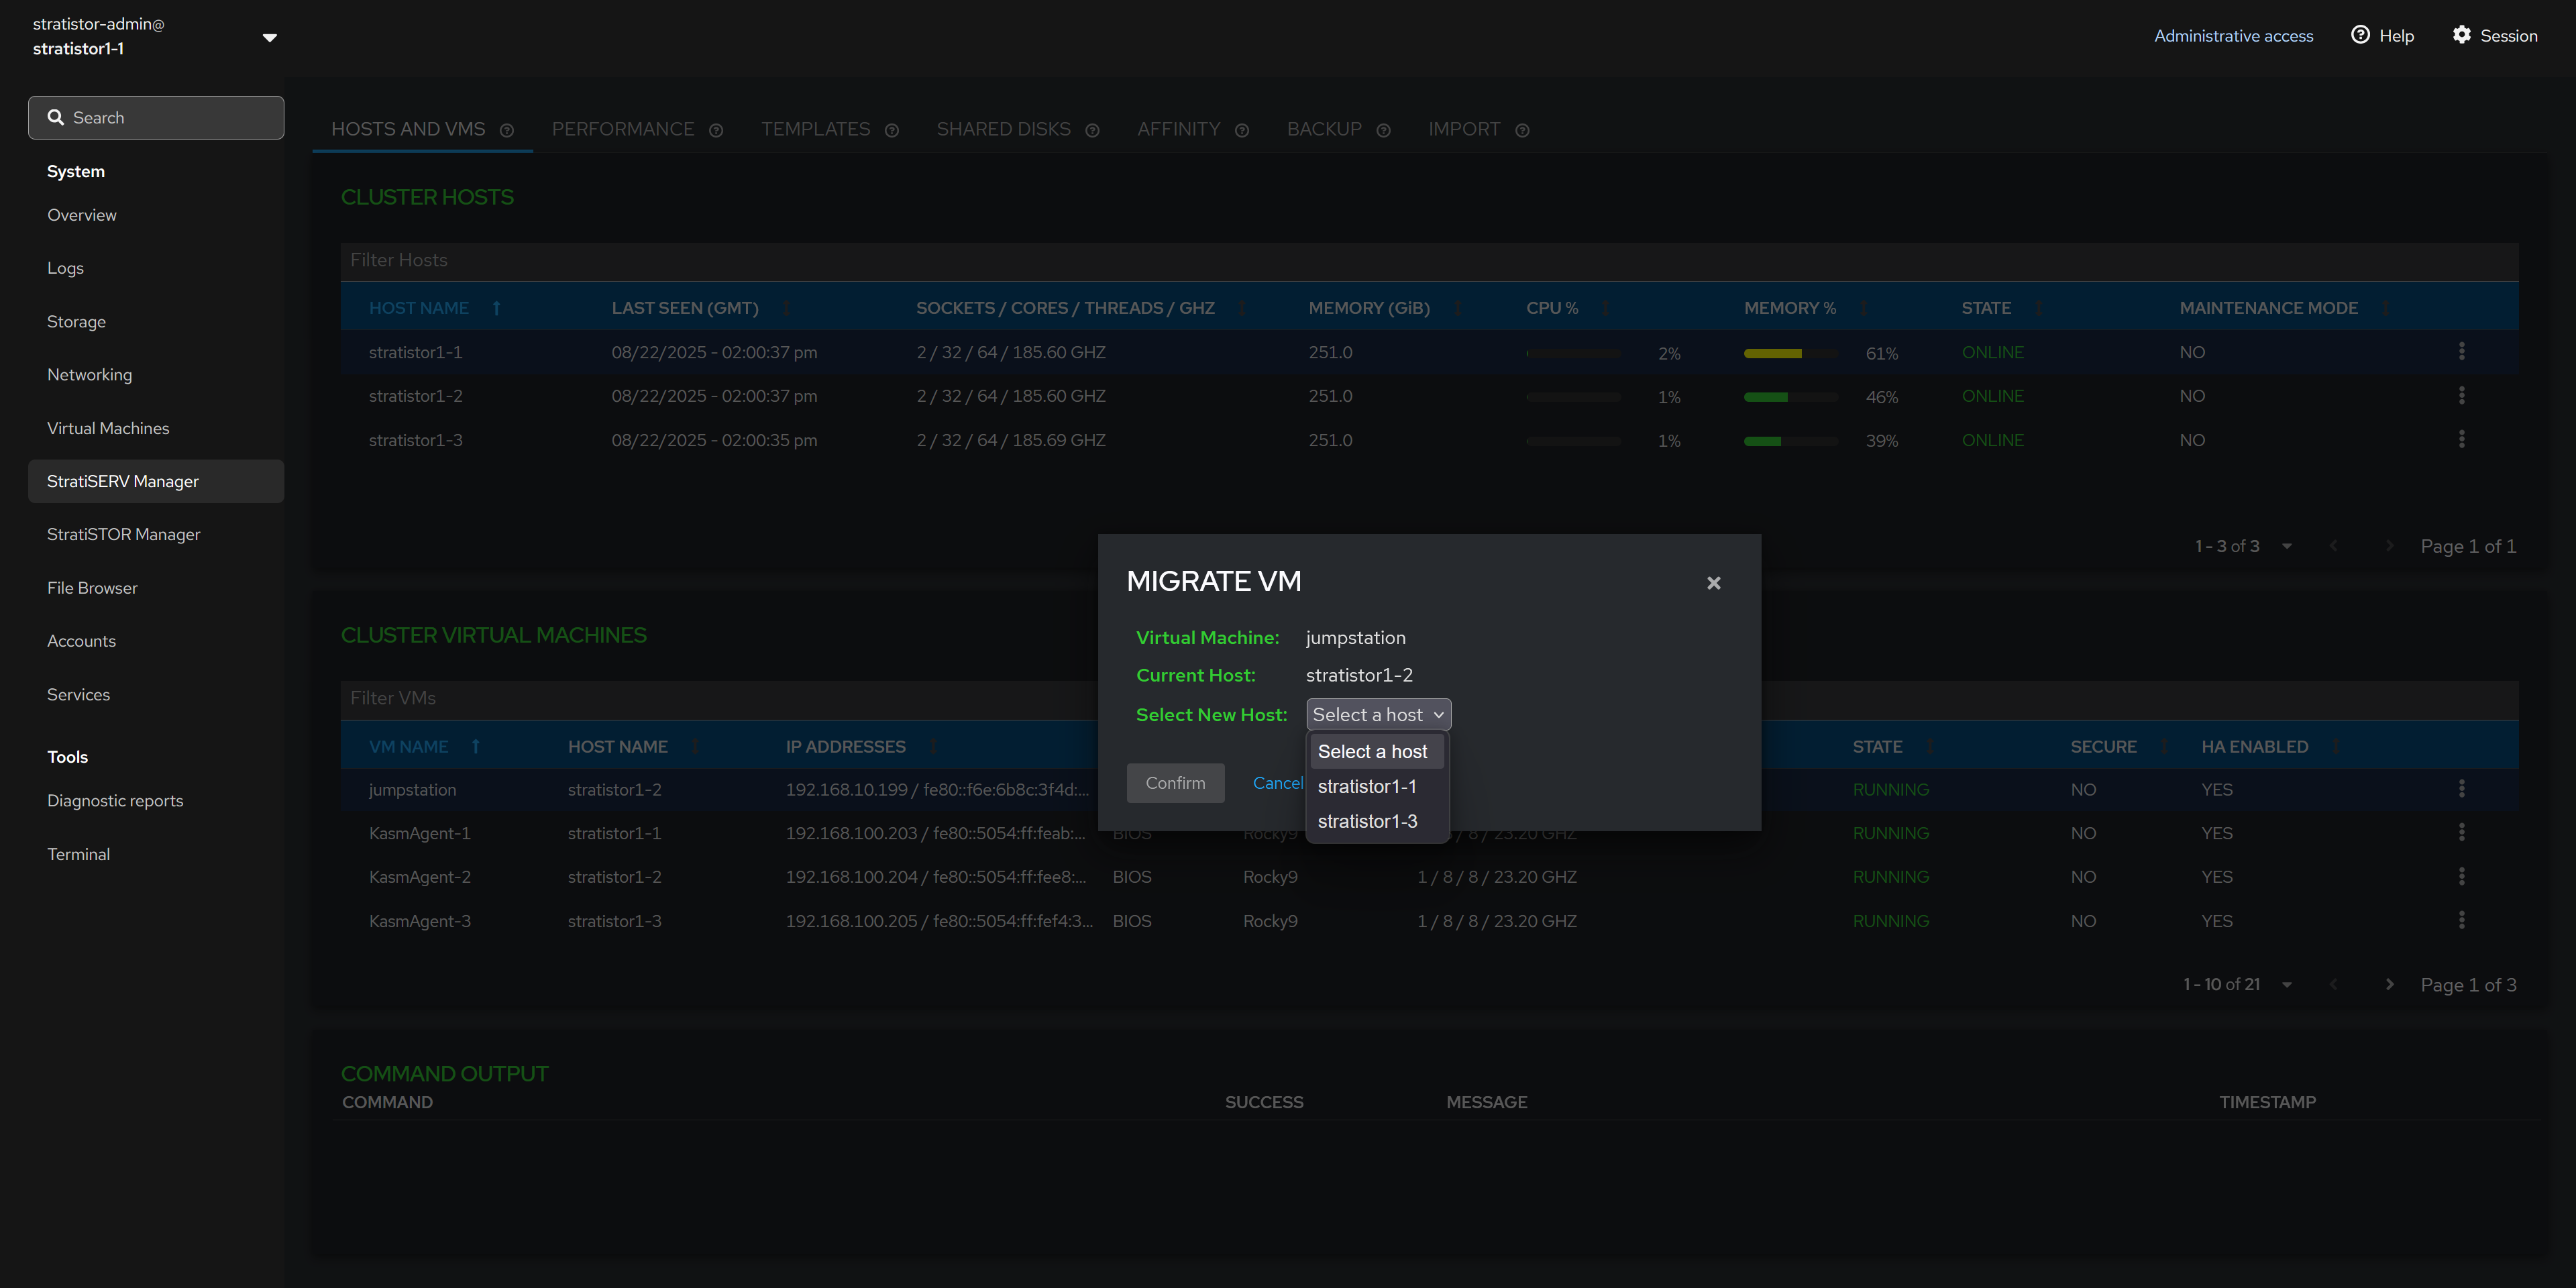
¶ HOSTS AND VMS - MIGRATE VM
To live migrate (or offline migrate) a VM from one host to another, select from the list of available hosts in the clutter and click CONFIRM. The list of available hosts will only include hosts which are online and not in maintenance mode.
¶ HOSTS AND VMS - MIGRATE VM DISKS
To migrate the VMs’ virtual disk(s), select the disks from the left side of the panel and the destination location on the right side of the pane.
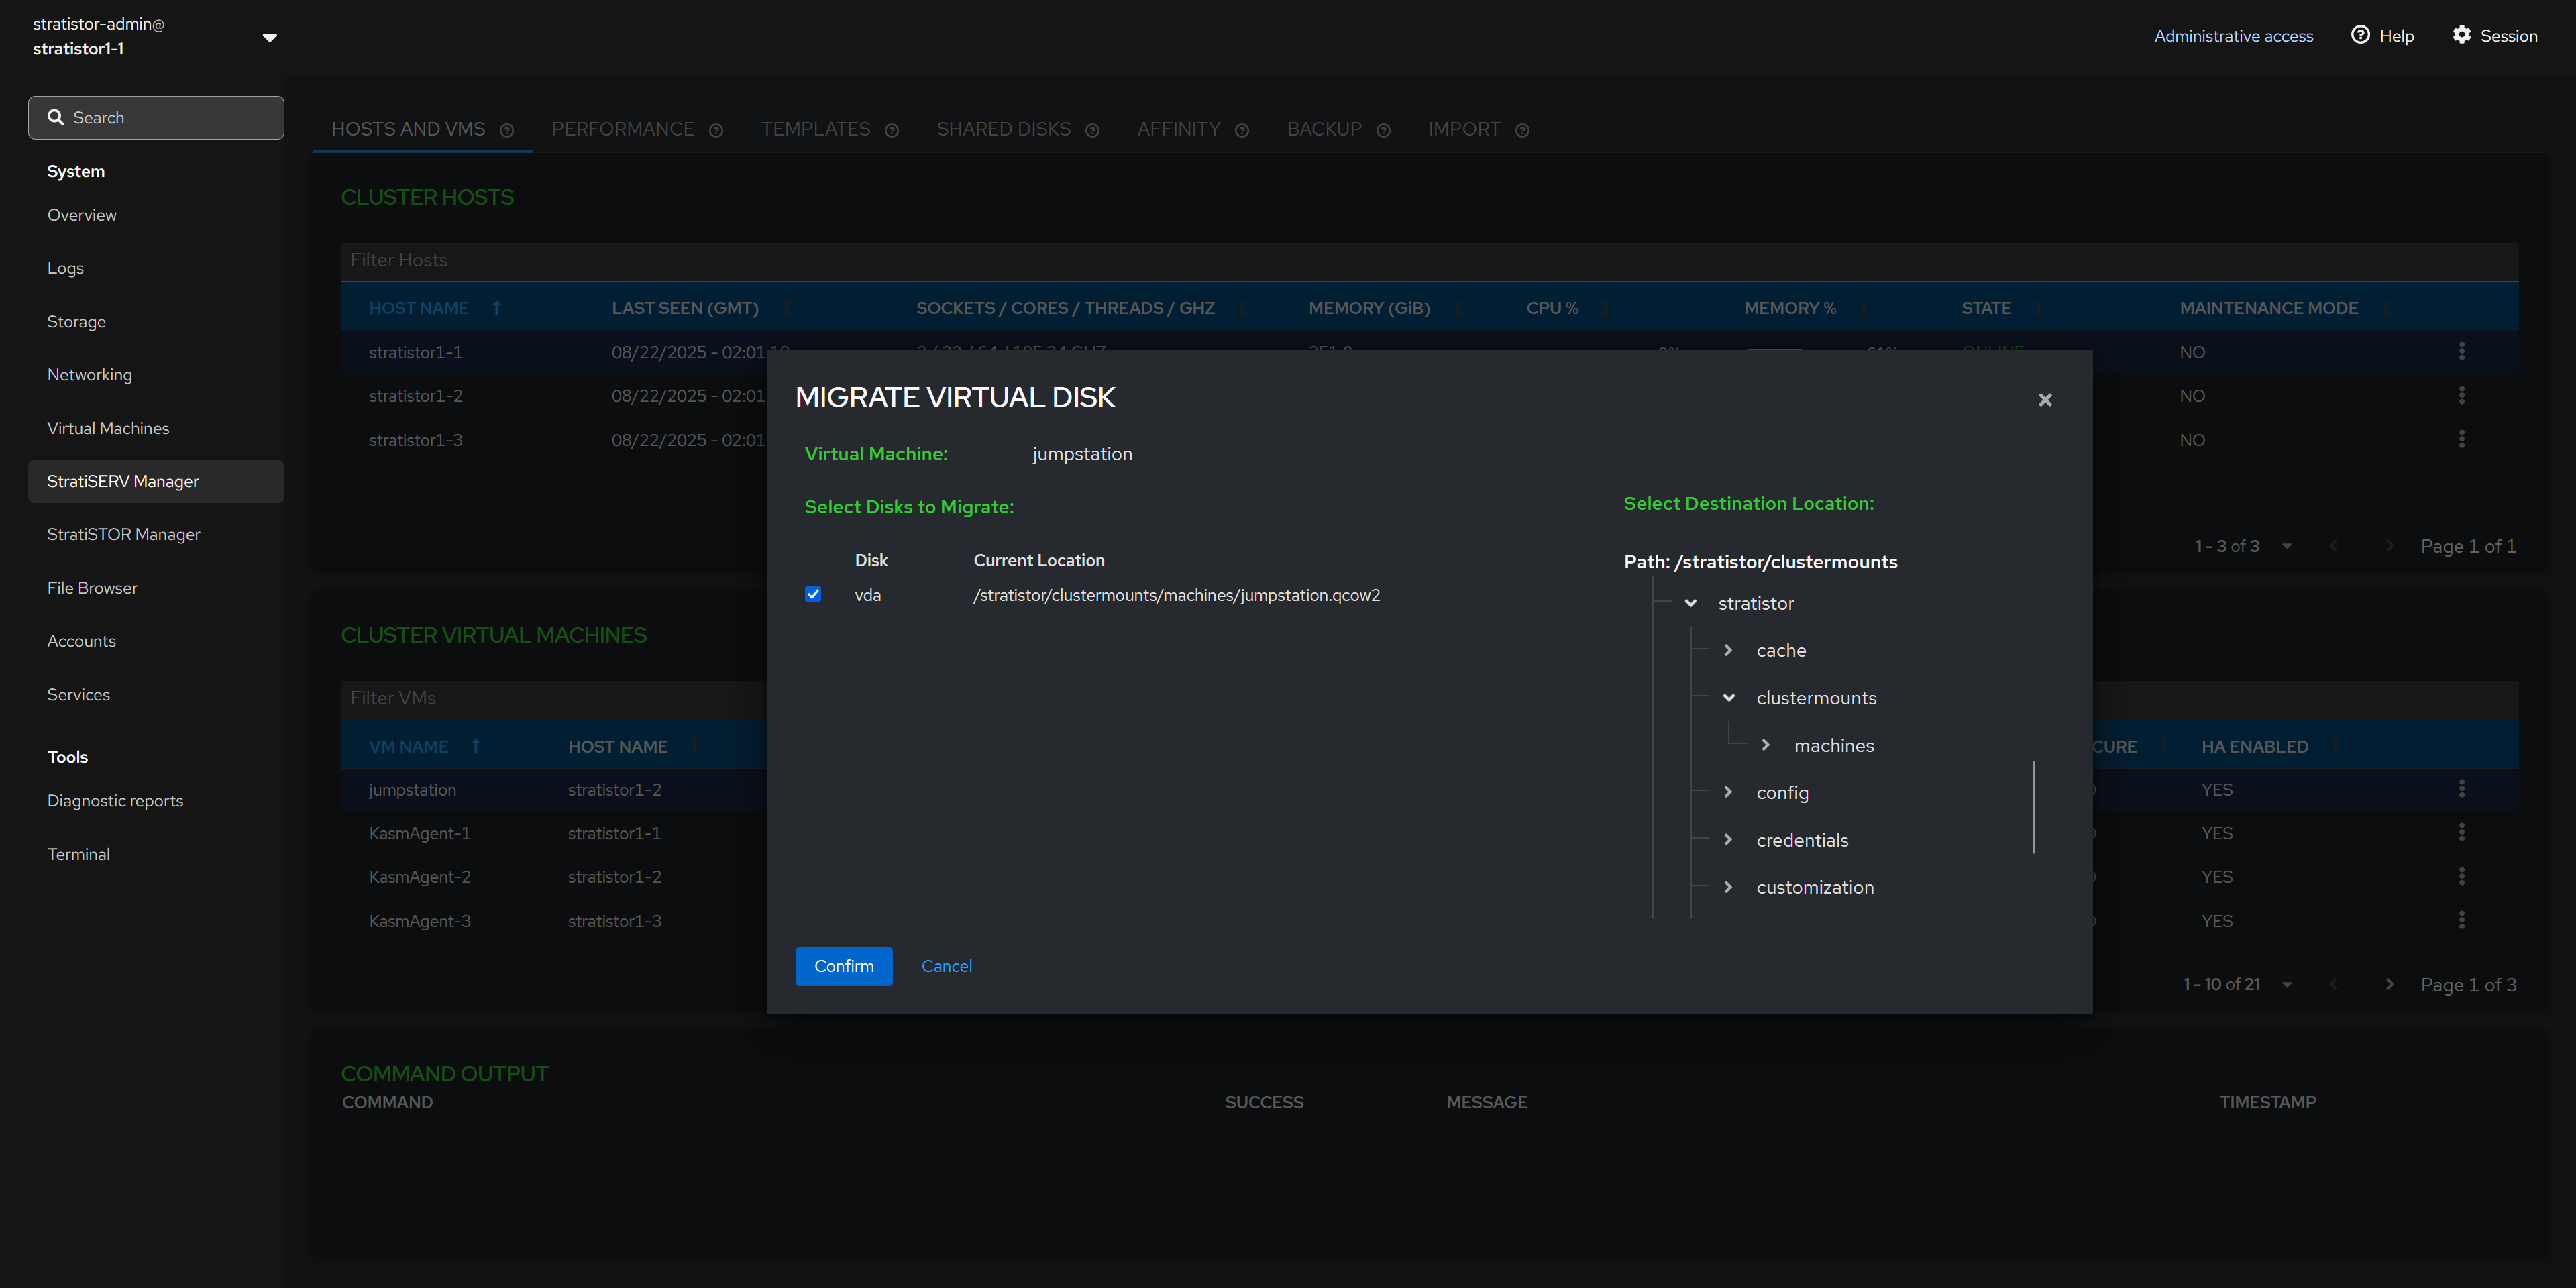
NOTE: If intending on using the VM across the hosts within the cluster, ensure that location is a shared location across all the hosts within the cluster. Without a shared location, you will not be able to perform live migration functions across the hosts.
¶ HOSTS AND VMS - CLONE VM
To clone a VM, ensure the VM is powered off. In the Clone VM view, provide a unique name for the VM. When ready to begin the clone process, click the CLONE button.
Cloning can be performed on VMs which utilize QCOW2, RAW, or StratiSTOR (RBD) backed disks.
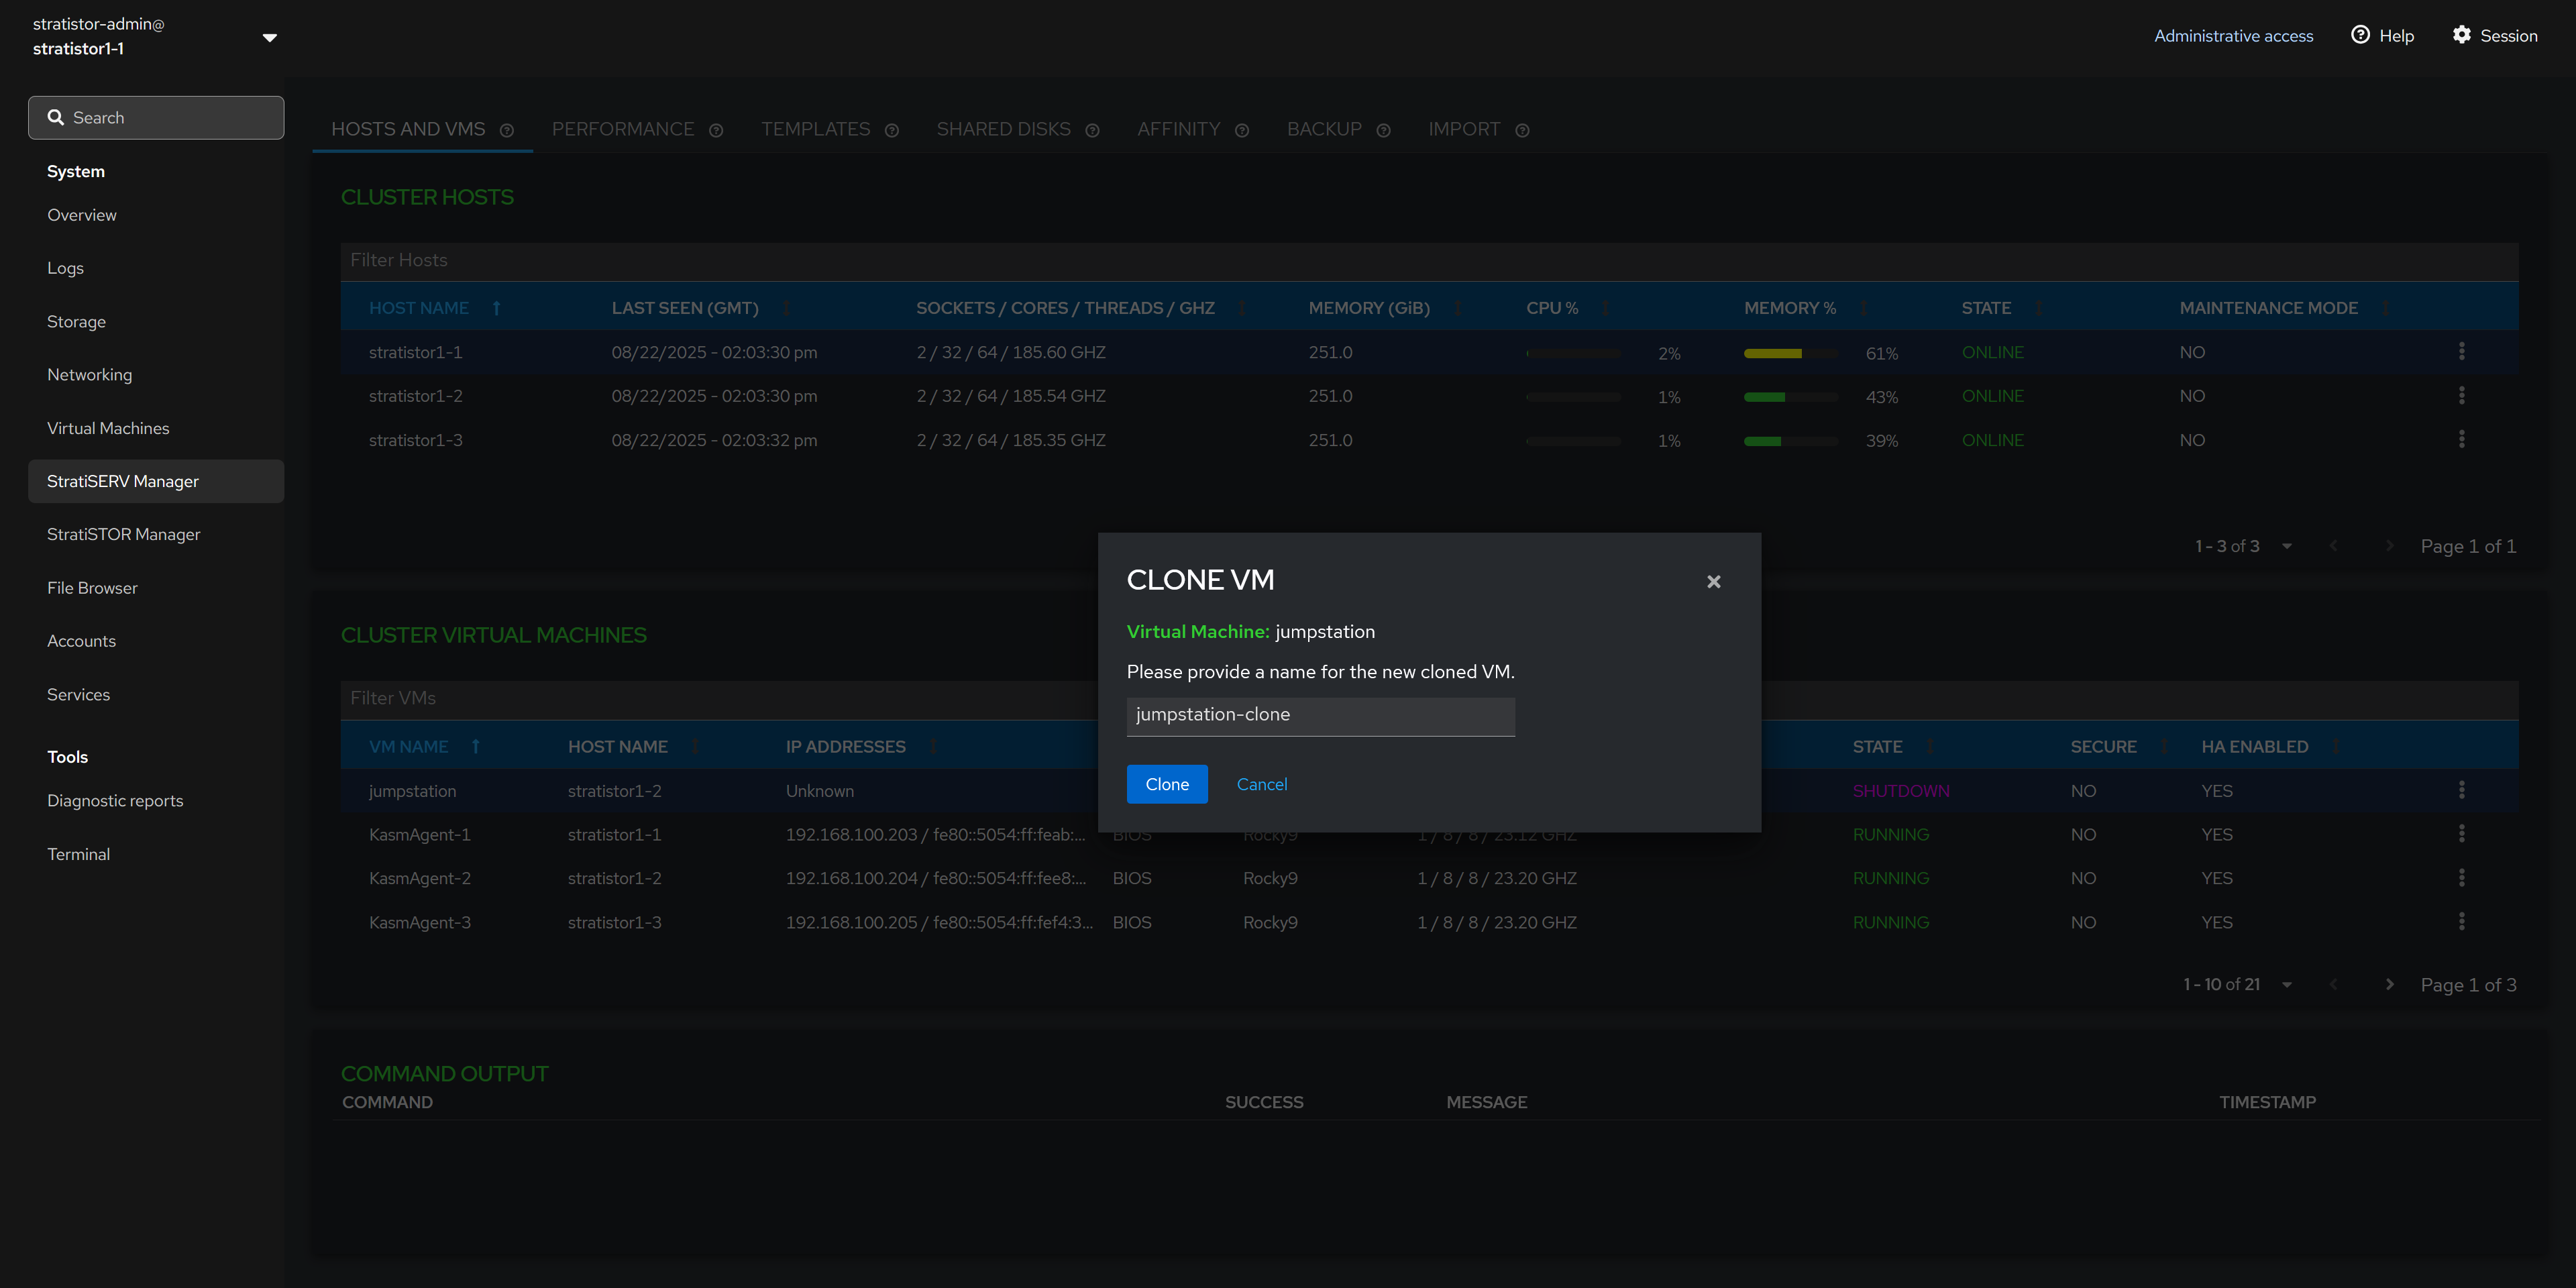
NOTE: If you are cloning a VM that has not been sysprep’d and the original VM is powered on while the clone is powered on, there is a possibility of identity collision on the network (i.e. hostname and/or IP address).
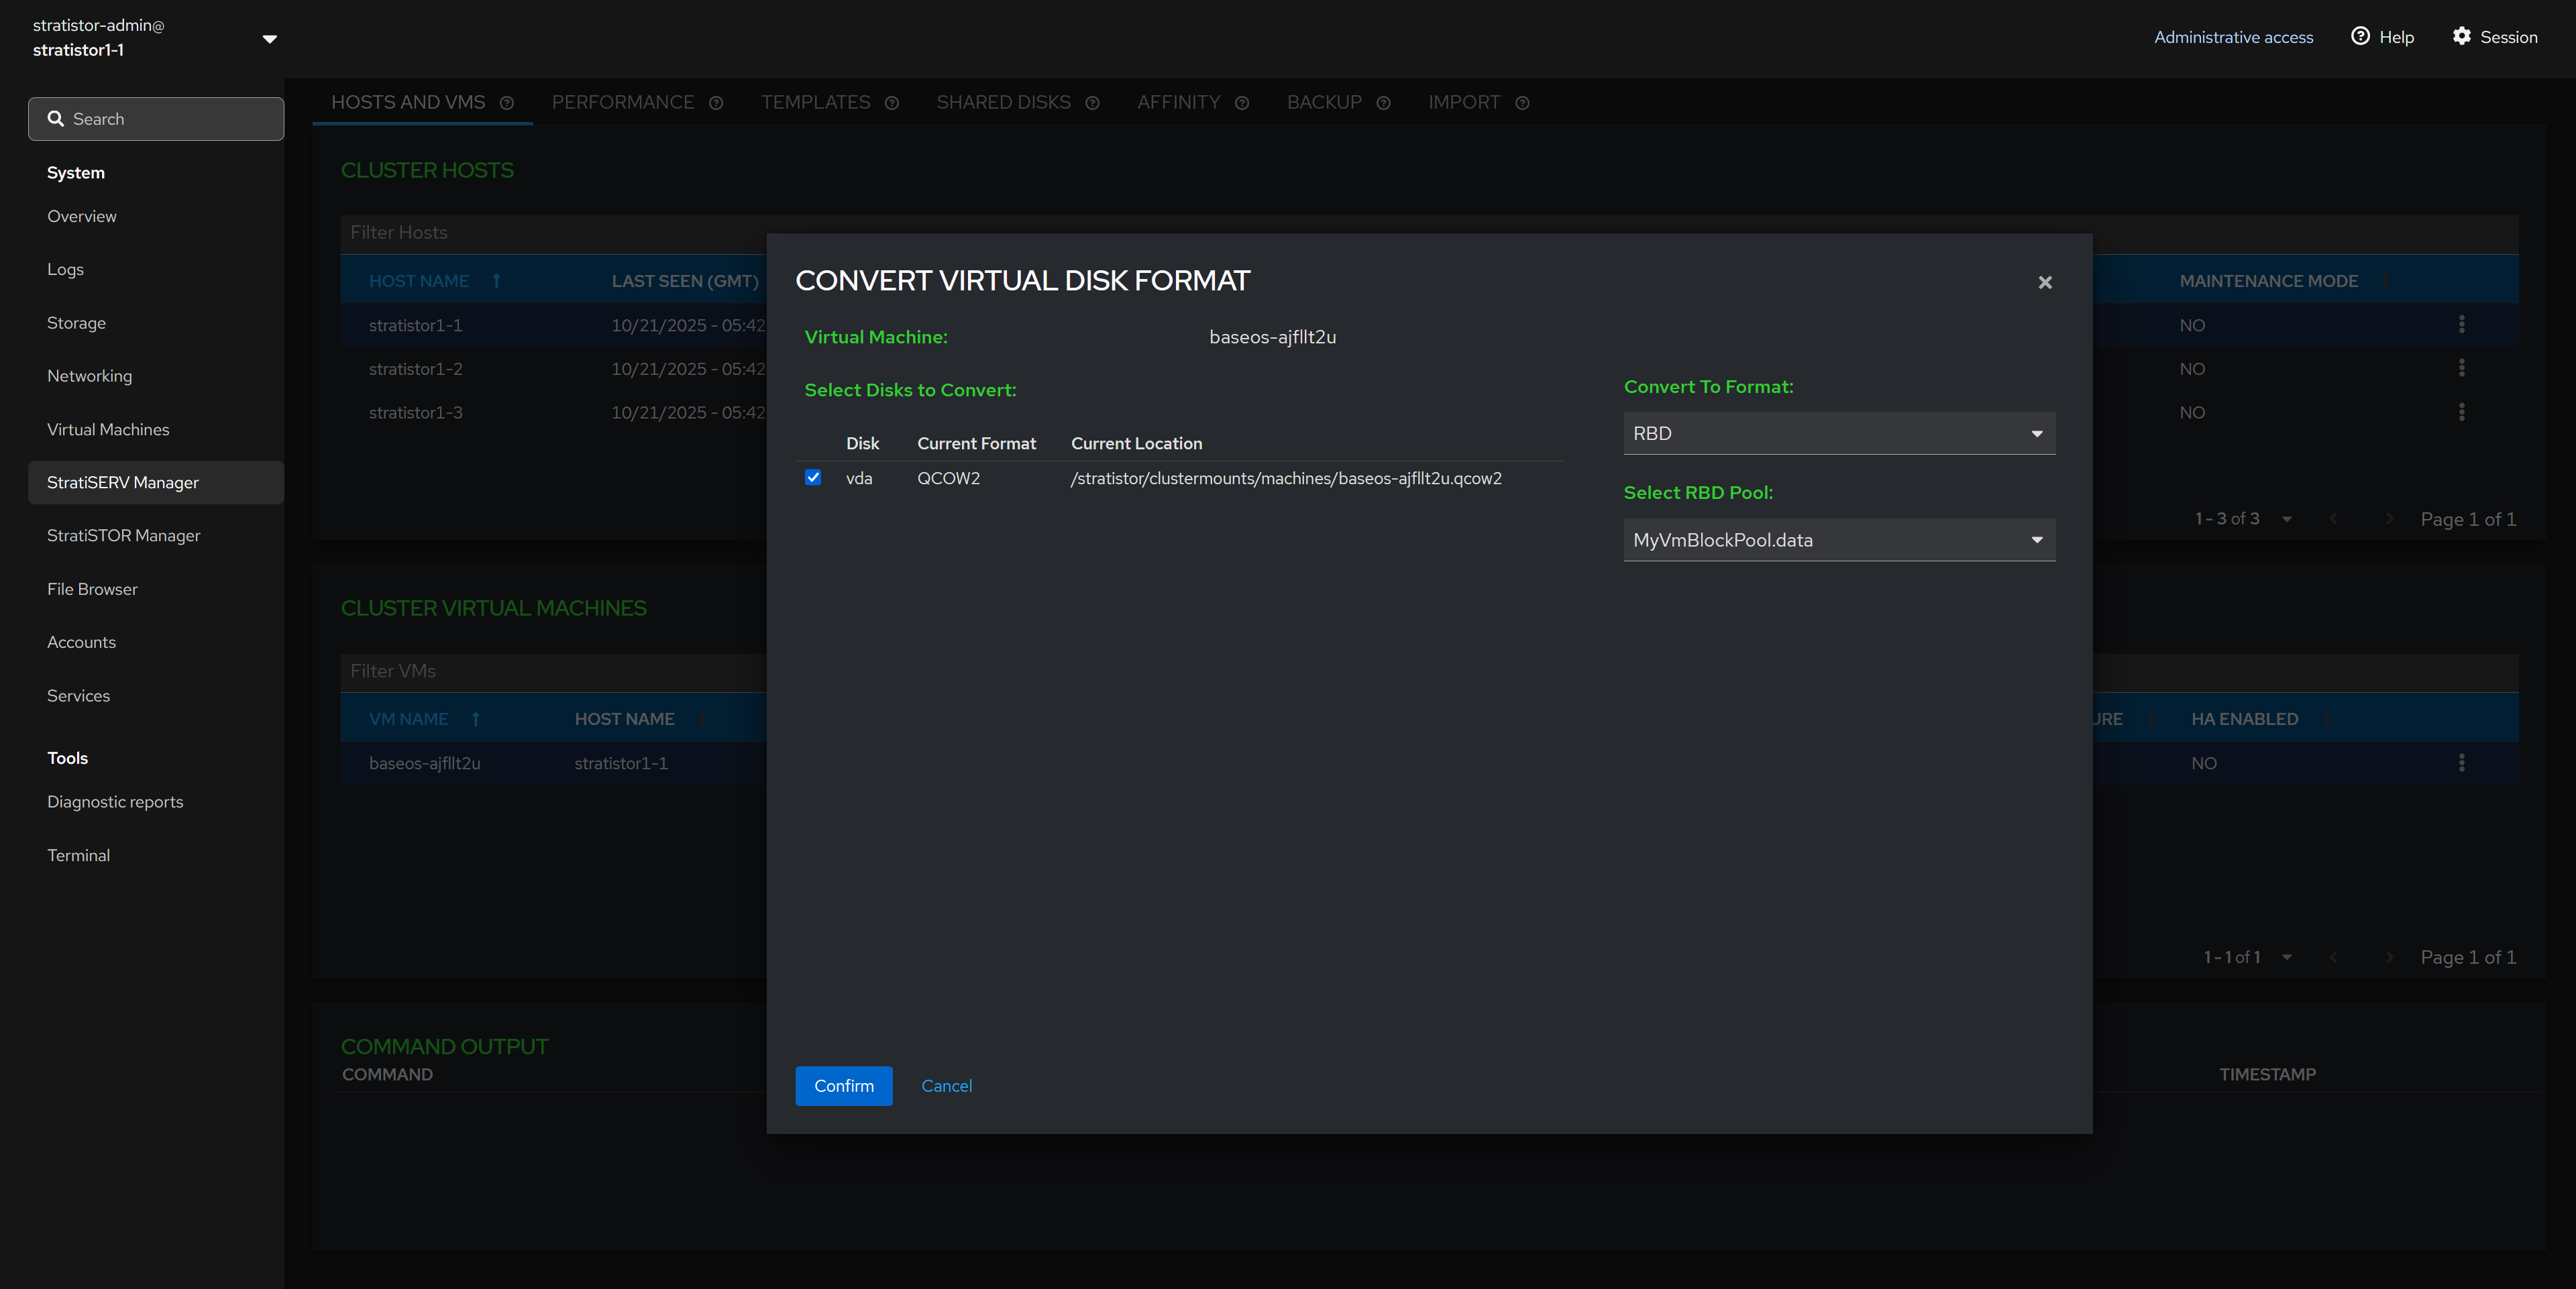
¶ HOSTS AND VMS - CONVERT VIRTUAL DISK FORMAT
To convert a VM’s disk image, first shut down the VM. Then select the VM, choose Convert VM, and open the Convert Virtual Disk Format wizard. In the wizard, select the disk or disks to convert and choose a destination format—QCOW2, RAW, VHD, VHDX, VMDK, or RBD—then review the summary and confirm.
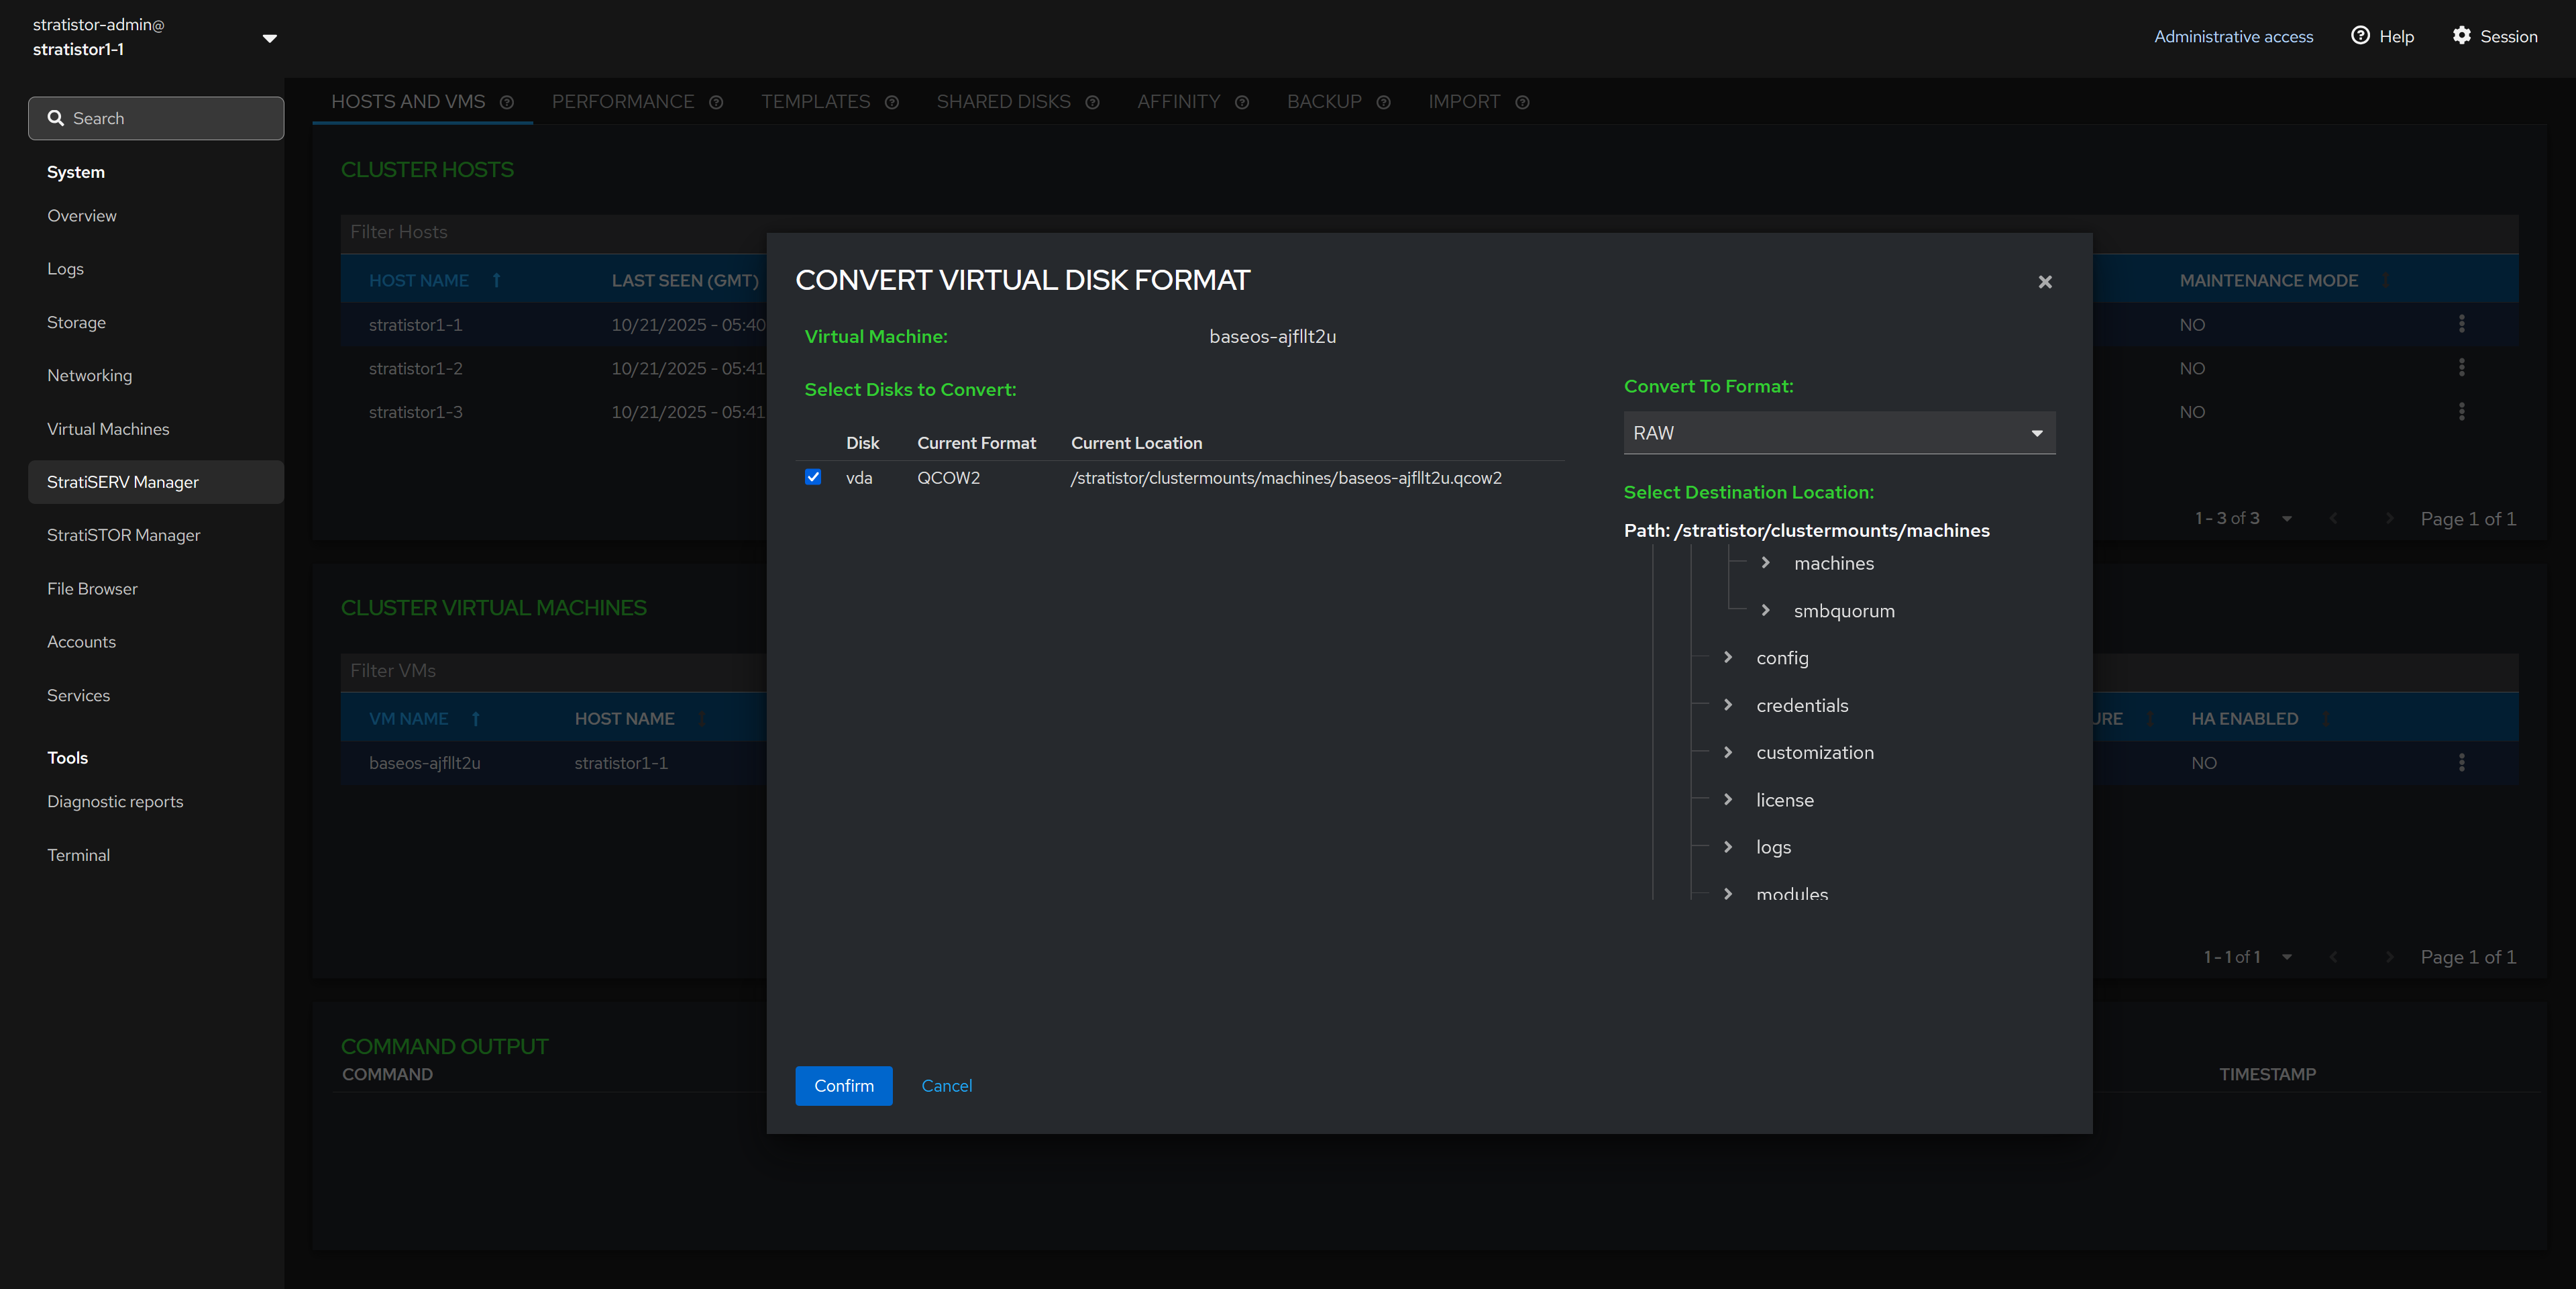
After conversion, VHD/VHDX/VMDK images are exported to the location you specify and the VM’s configuration is not changed. For QCOW2/RAW/RBD, the VM is updated to use the new image (the original disk reference is replaced).
If converting to RBD, the wizard writes to the selected StratiSTOR pool/image name; for file-based formats, it writes to the filesystem path you provide. Ensure you have adequate free capacity at the destination.
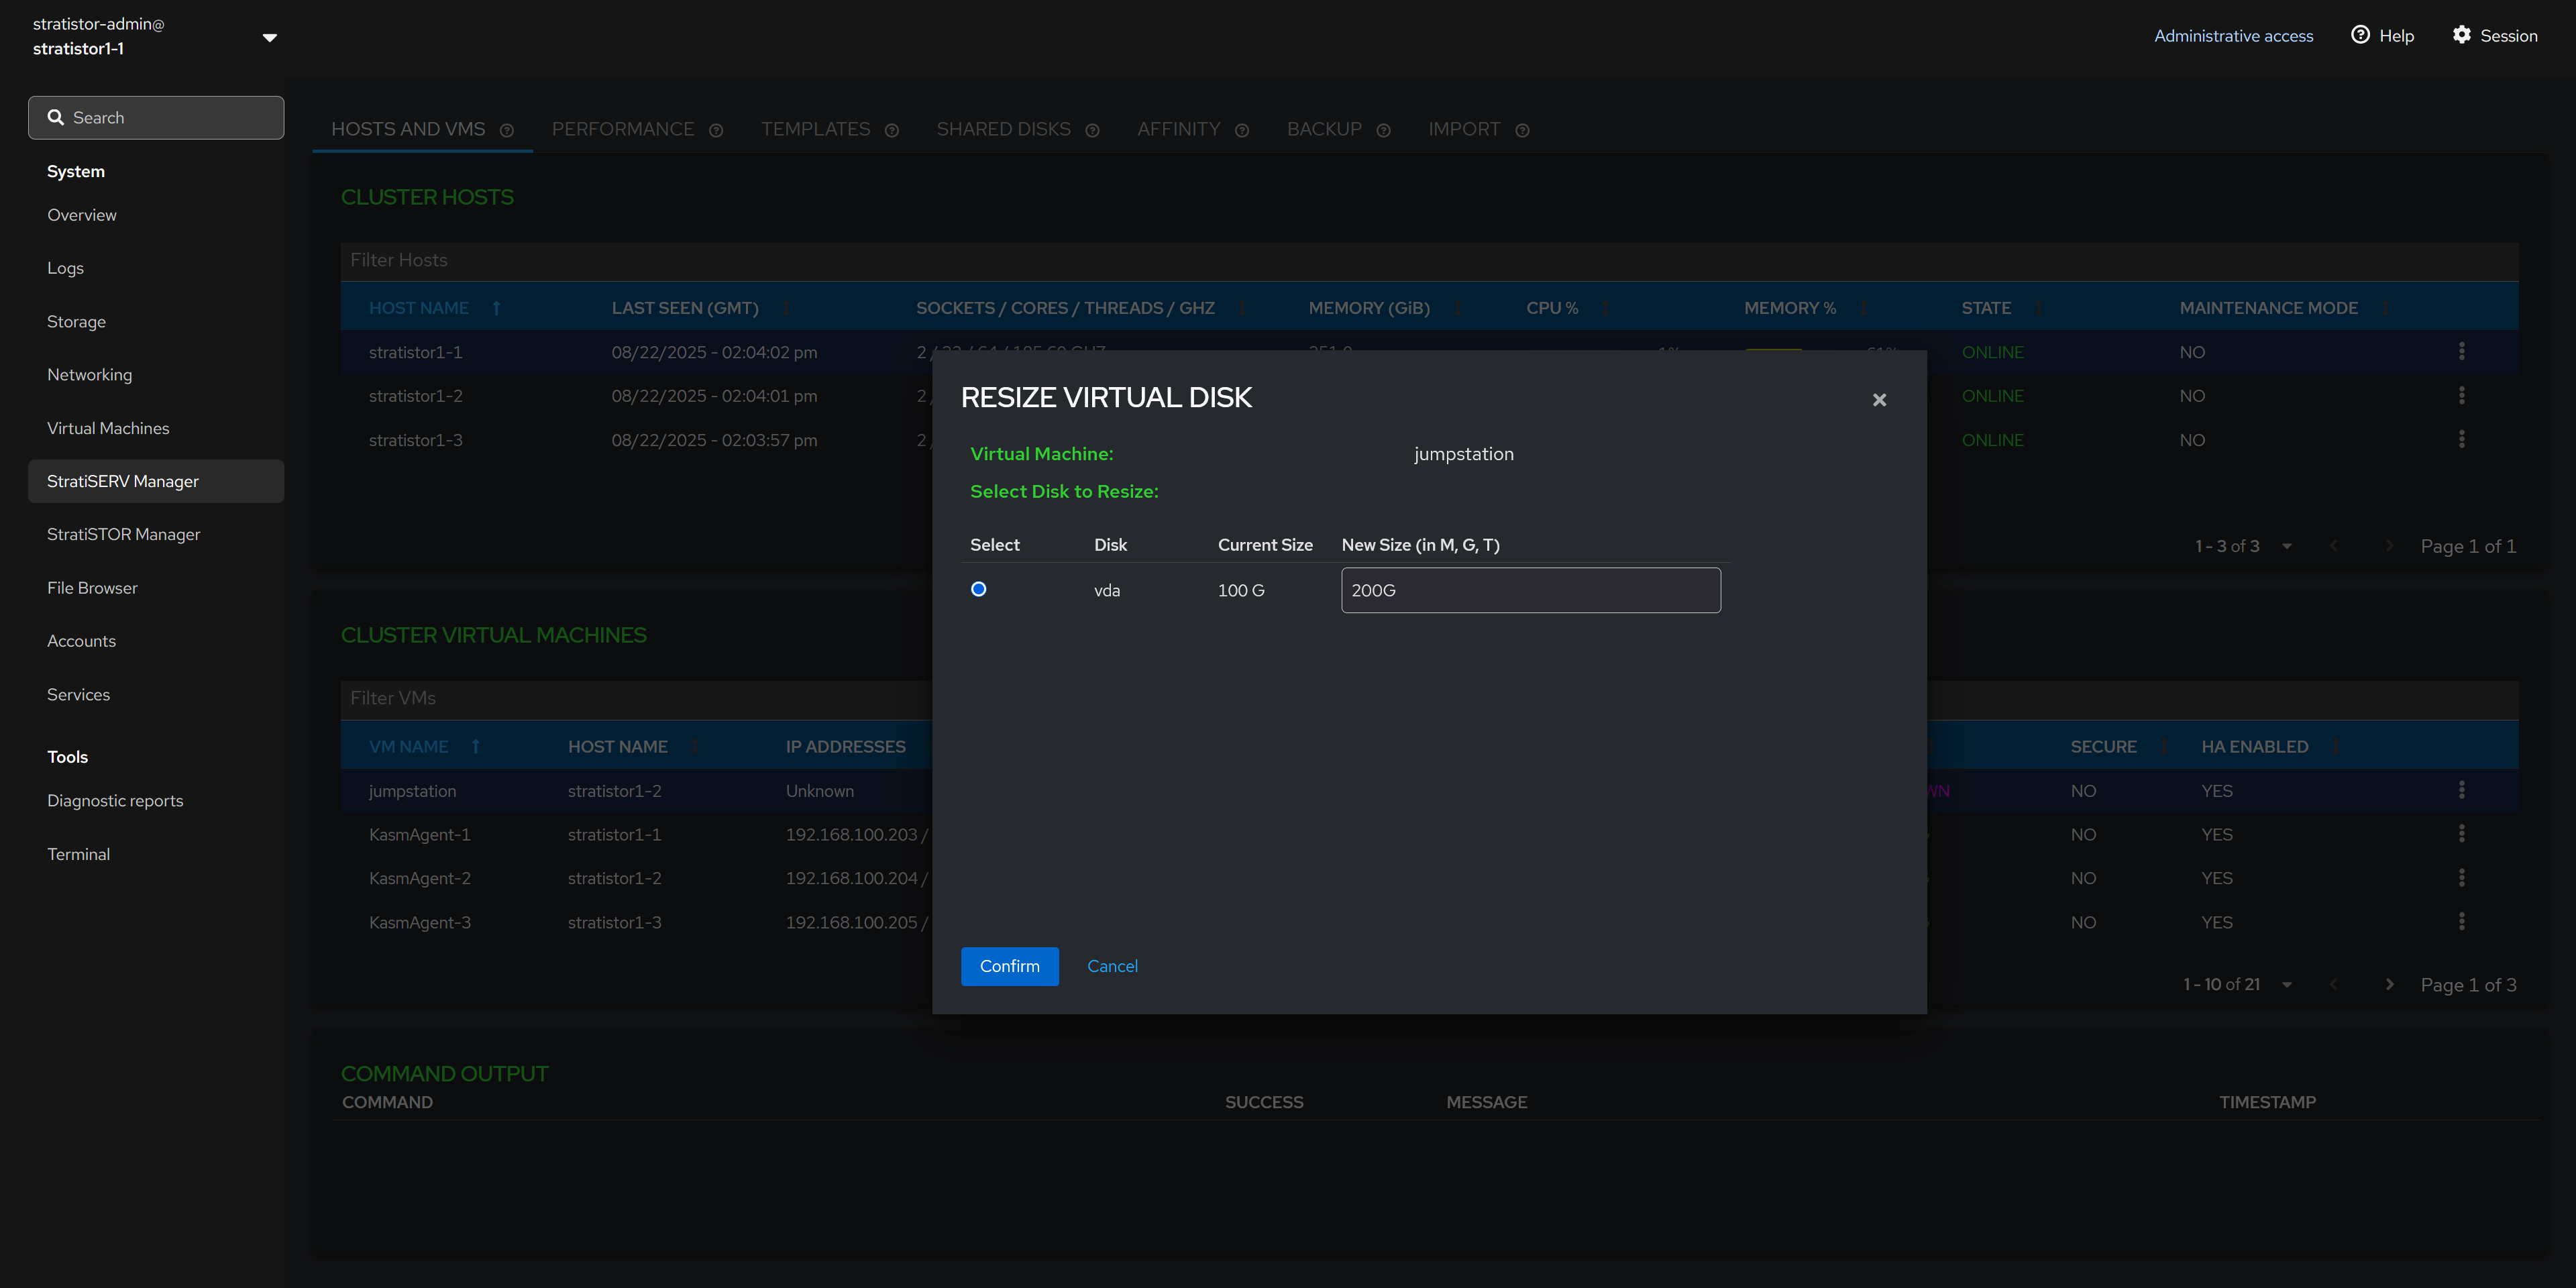
¶ HOSTS AND VMS - RESIZE VM DISKS
To resize a virtual machine disk image, first ensure that the VM is powered off. Next, select the virtual volume to be resized, provide the new desired virtual volume size with units (i.e. G for gigabytes, T for terabytes). When ready to proceed, click the CONFIRM button.
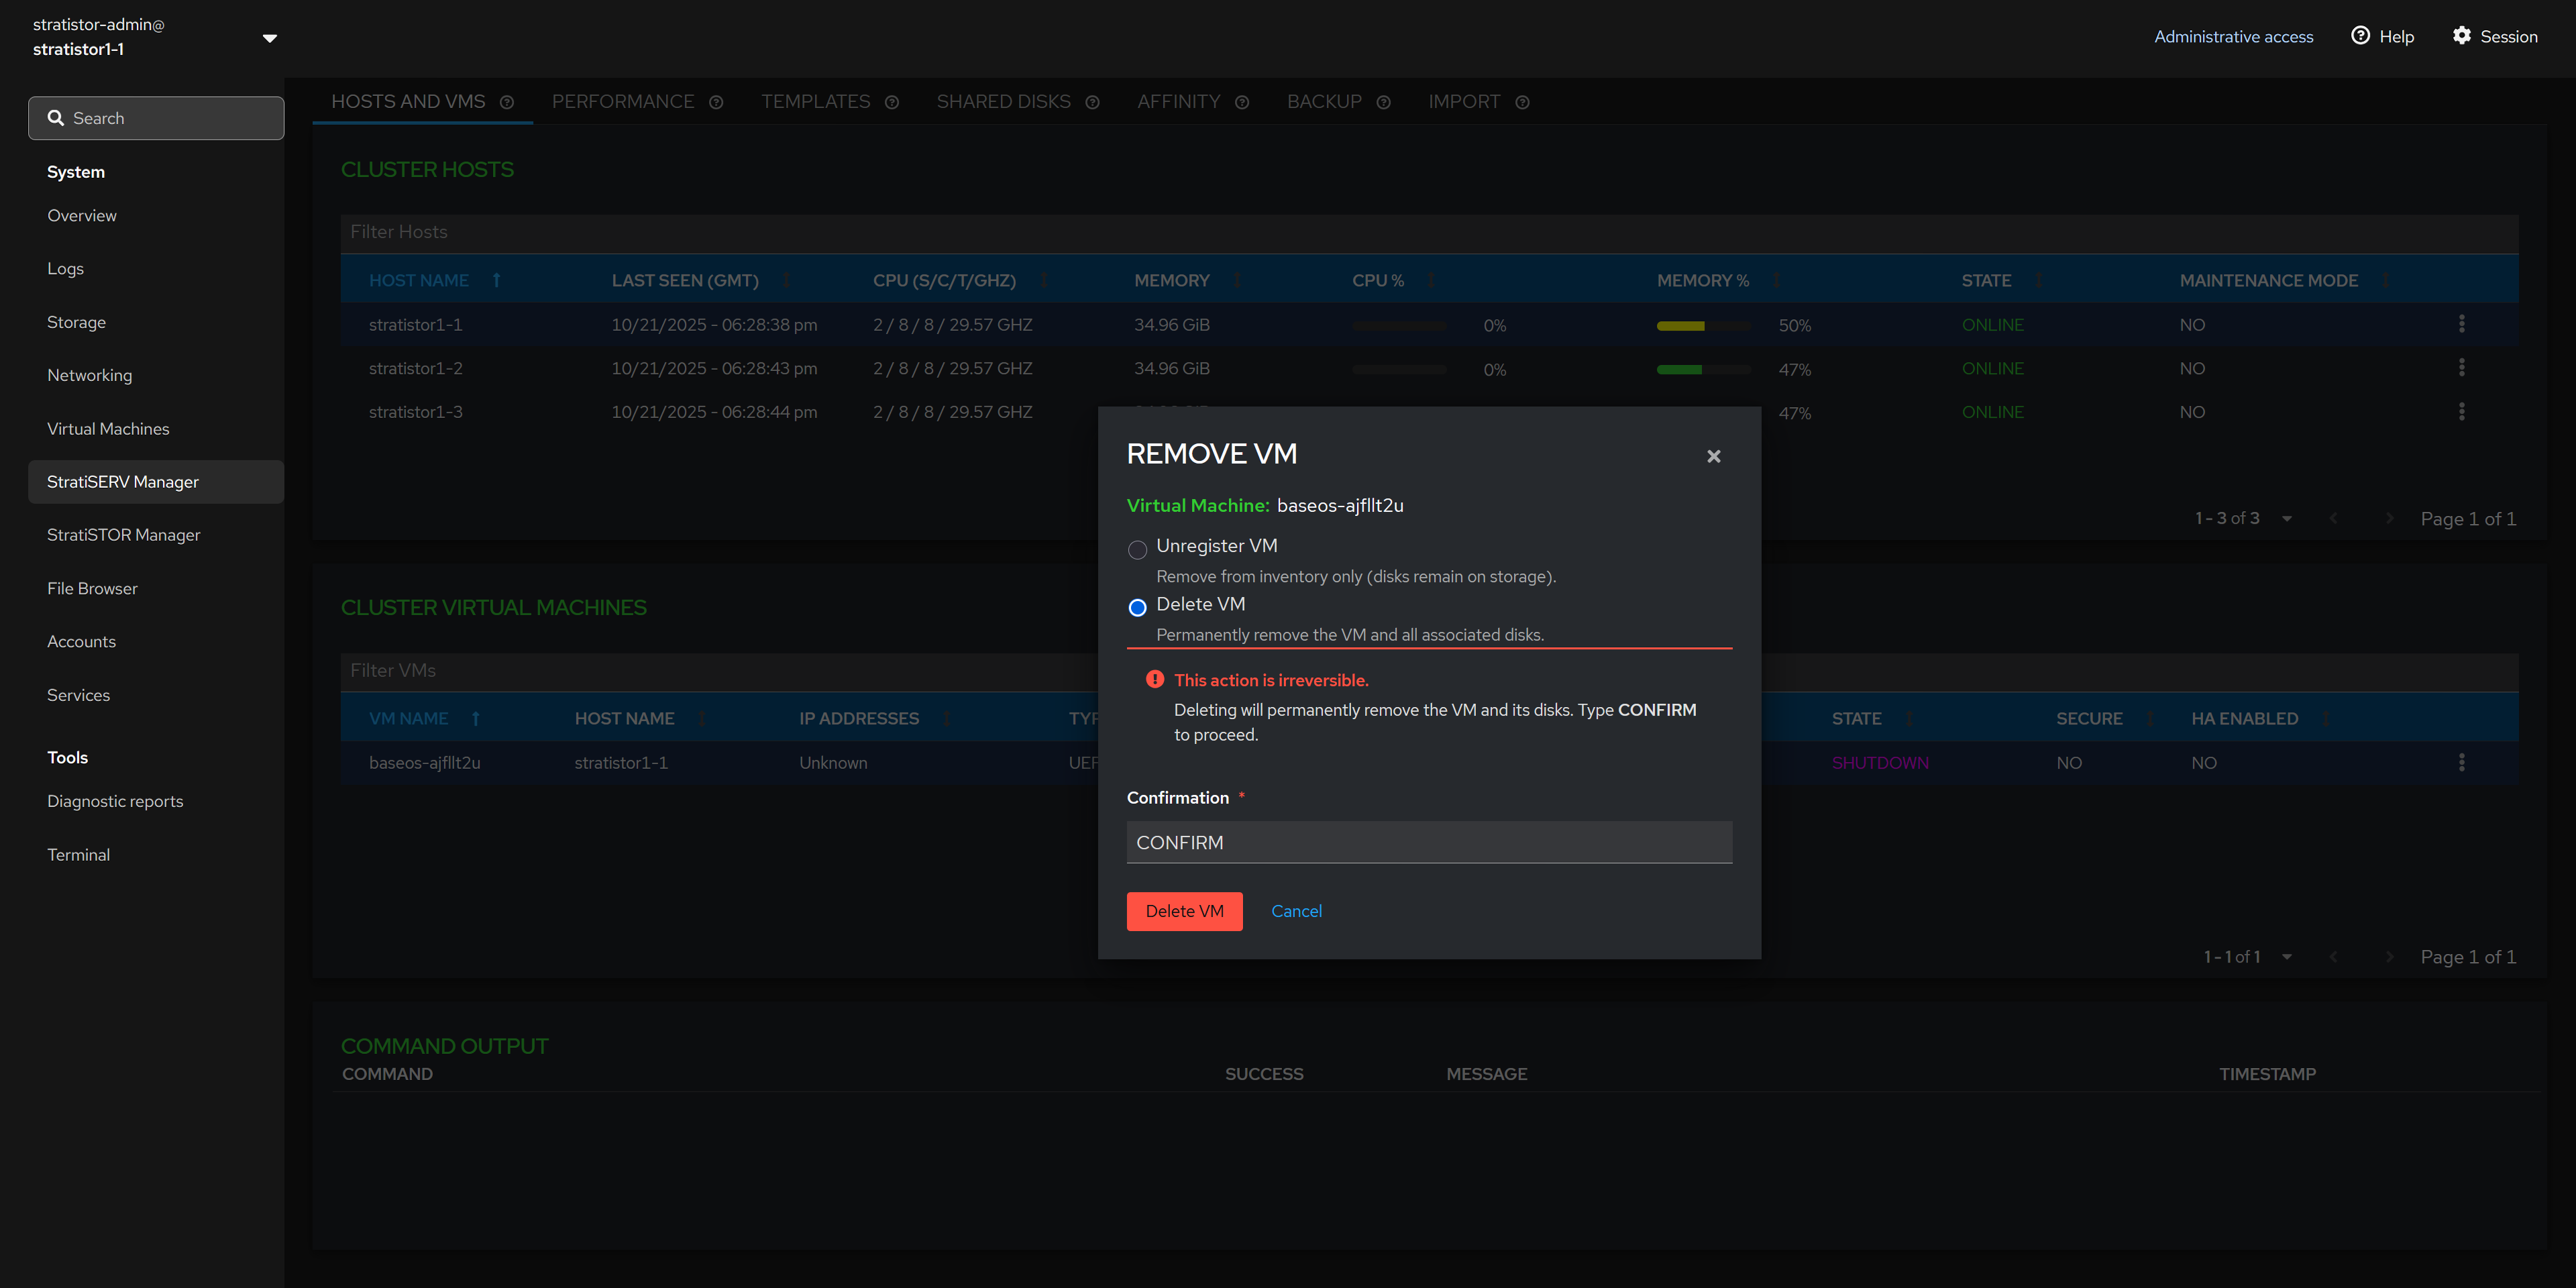
¶ HOSTS AND VMS - REMOVE VM FROM INVENTORY
The remove VM options allows you to either unregister or delete the VM. Unregistering the VM will remove it from VM inventory but leave the virtual disks unaltered. Deleting the VM will remove the VM from inventory and delete all associated virtual disks attached to the VM.
¶ HOSTS AND VMS - CONVERT VM TO TEMPLATE
To designate a VM as a template, ensure that the VM operating system has been properly prepared using sysprep tools. When ready to proceed, ensure the VM is powered off.
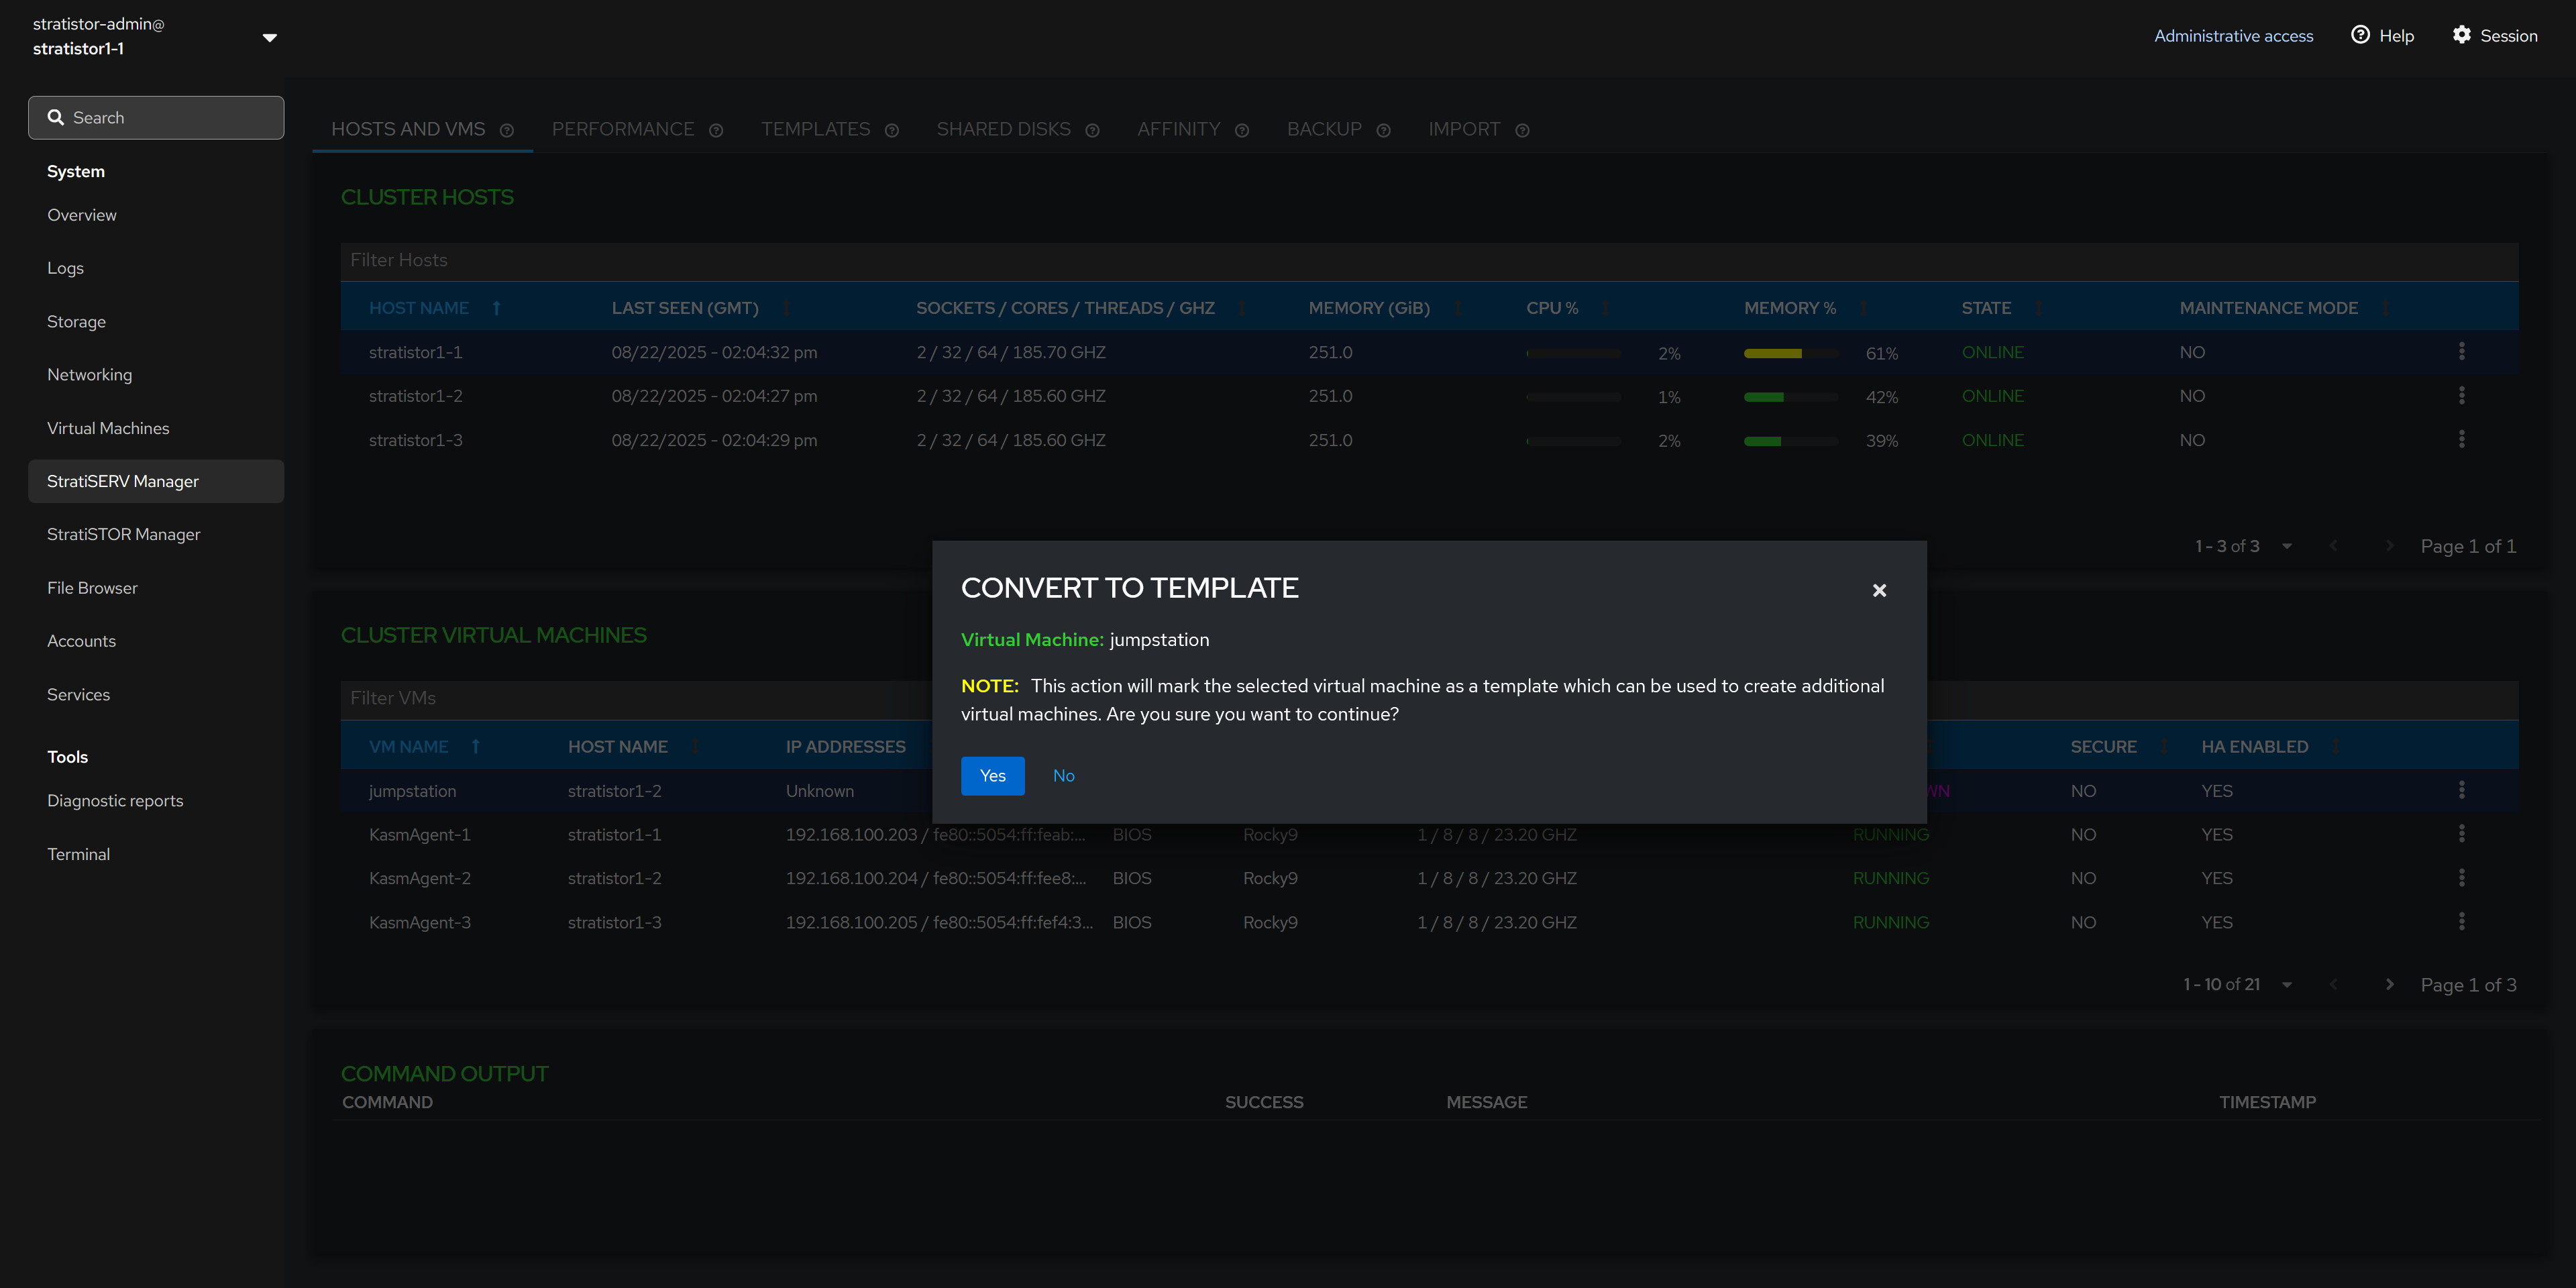
The conversion process is immediate and the VM will be removed from the VM inventory pane and will now be visible from the Template View.
¶ HOSTS AND VMS - VM SETTINGS
There are additional VM settings which can be enabled or disabled based on the VM configuration requirements. They can be applied with the VM powered on or off. However, if the changes are made while the VM is powered on, you will need to shutdown the VM completely and then power it back on in order for the changes to take effect.
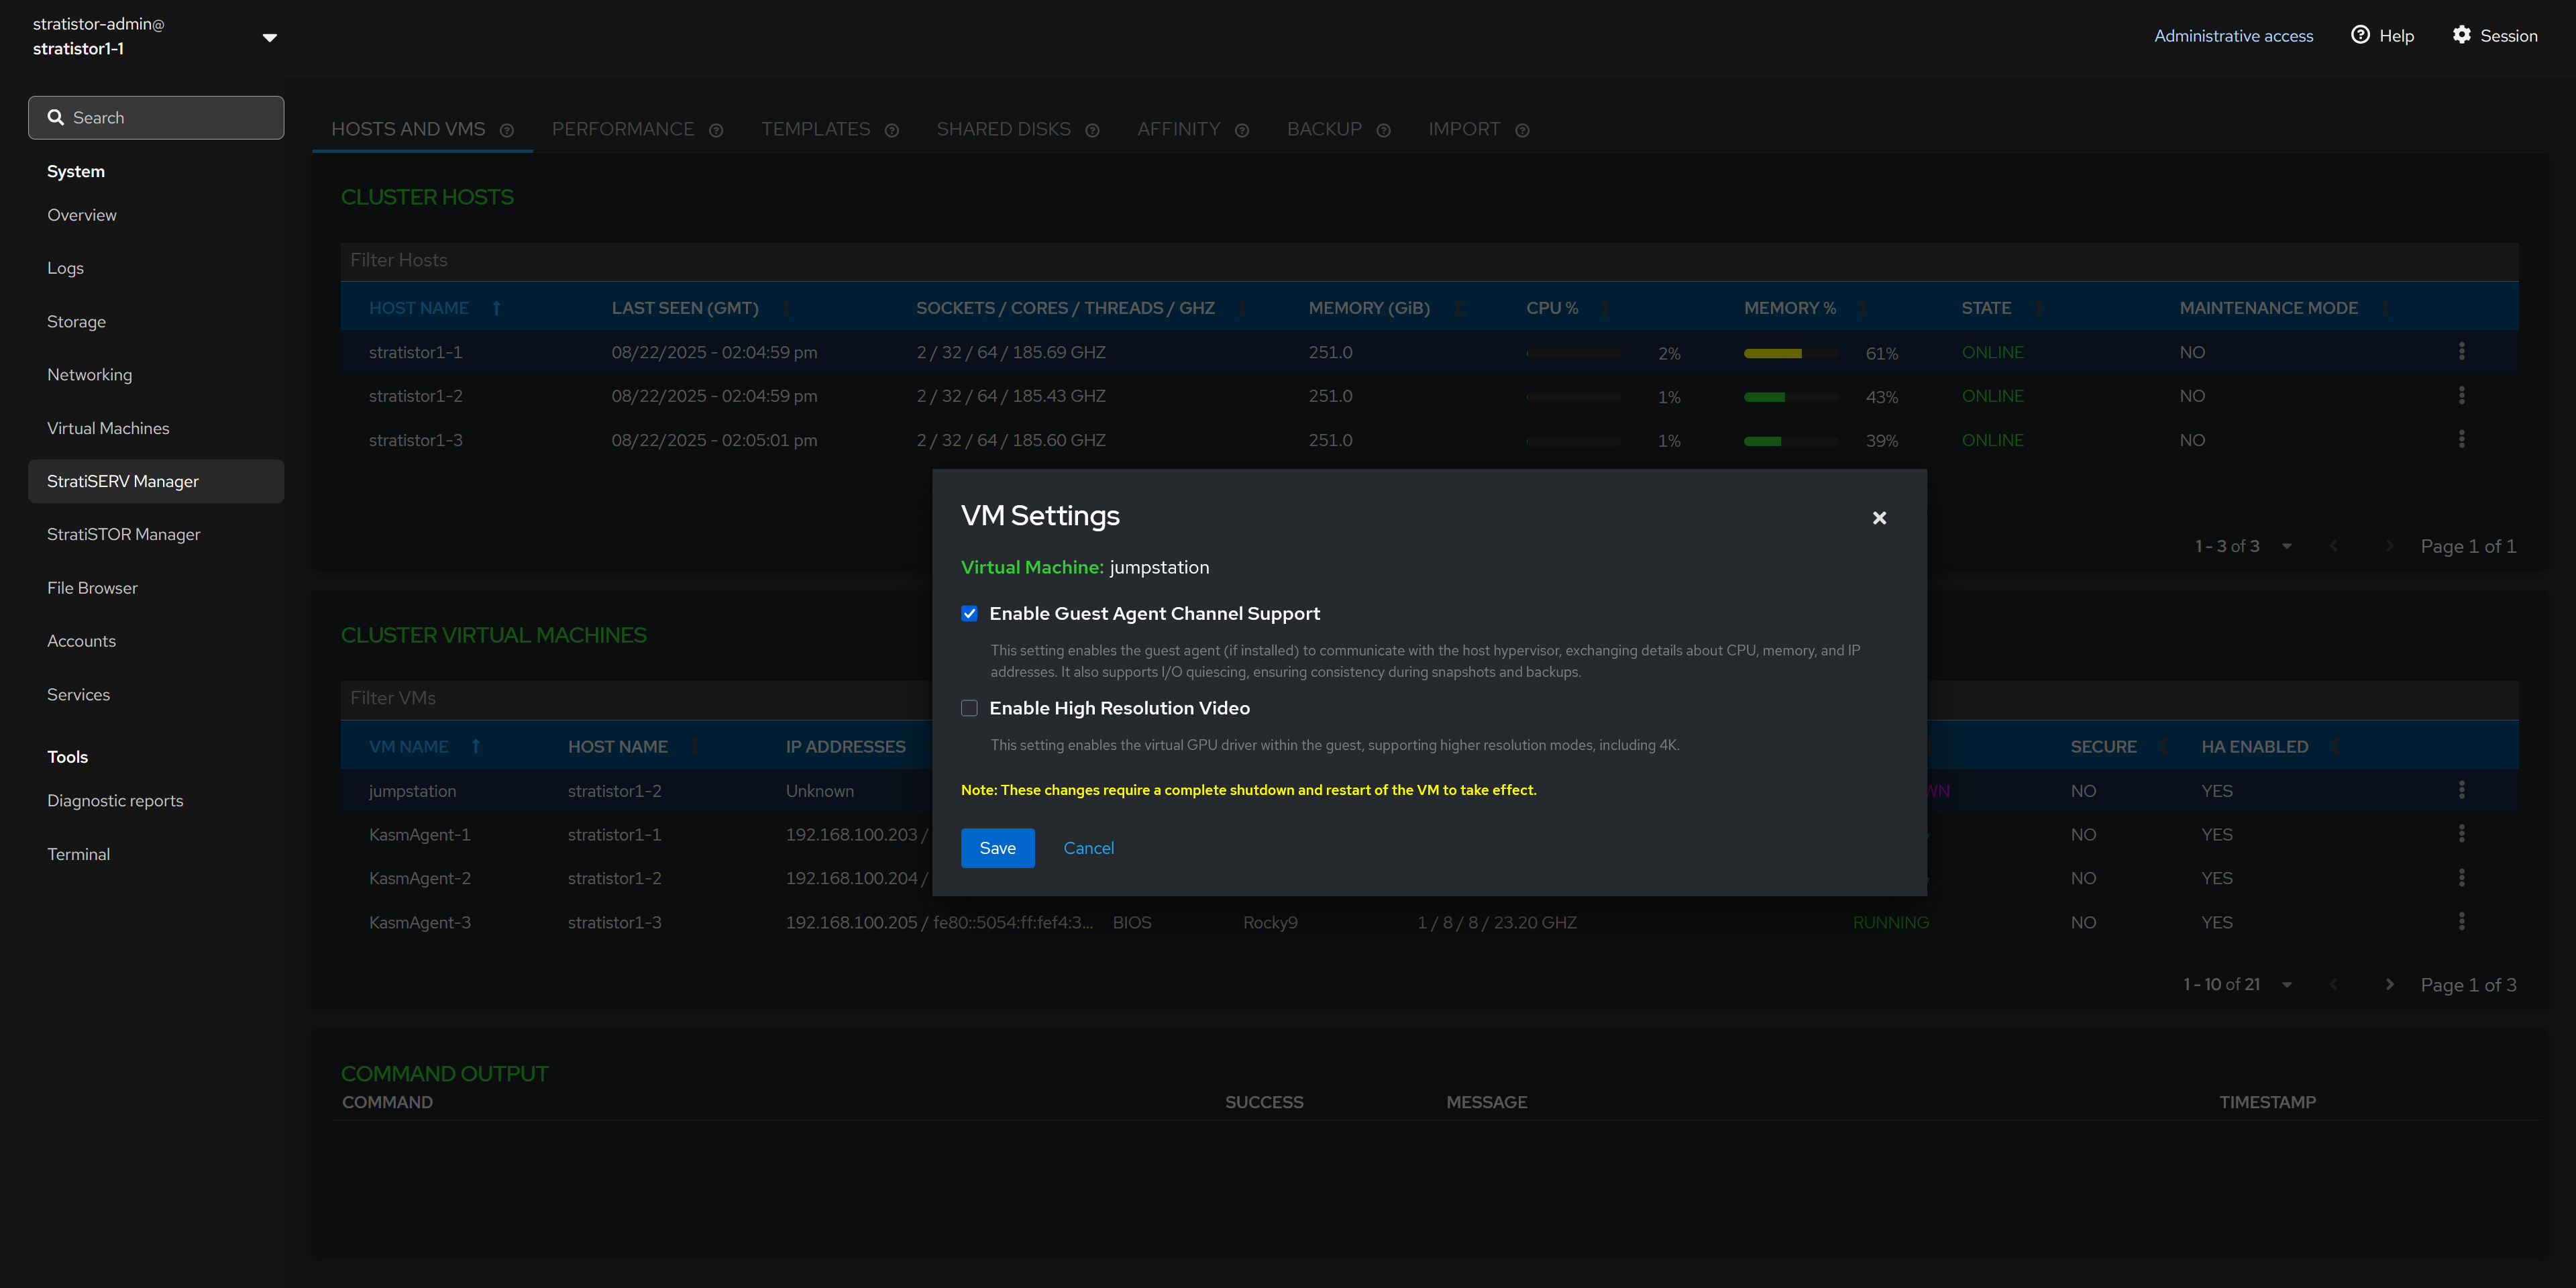
- The Guest Agent Channel Support is used for enabling the virtio guest agent to communicate and exchange information with the hypervisor such as IP address and liveliness conditions. [RECOMMENDED]
- The High Resolution Video support enables guest VMs with full GUI based operating systems to run at resolutions as high as 4K. [OPTIONAL]
- The Confidential Computing support enables complete VM isolation and an encrypted memory space for ultra-high security environments. Requires Intel TDX or AMD SEV processor support. [OPTIONAL]
¶ CONTAINERS
If container (Kubernetes) services are enabled on the cluster, you will see the Containers tab at the top of the StratiSERV Manager view.
NOTE: If you are presented with a certificate warning, click on the info icon (i) next to the container management title. This will open a dedicated window where you can accept the self-signed certificate. Once accepted, you can close that window and use the refresh icon to reload the embedded window.

Once logged into the container management interface, you will see the main environment management console. You can manage all Kubernetes-based clusters and containers running locally or remotely from this single management console.
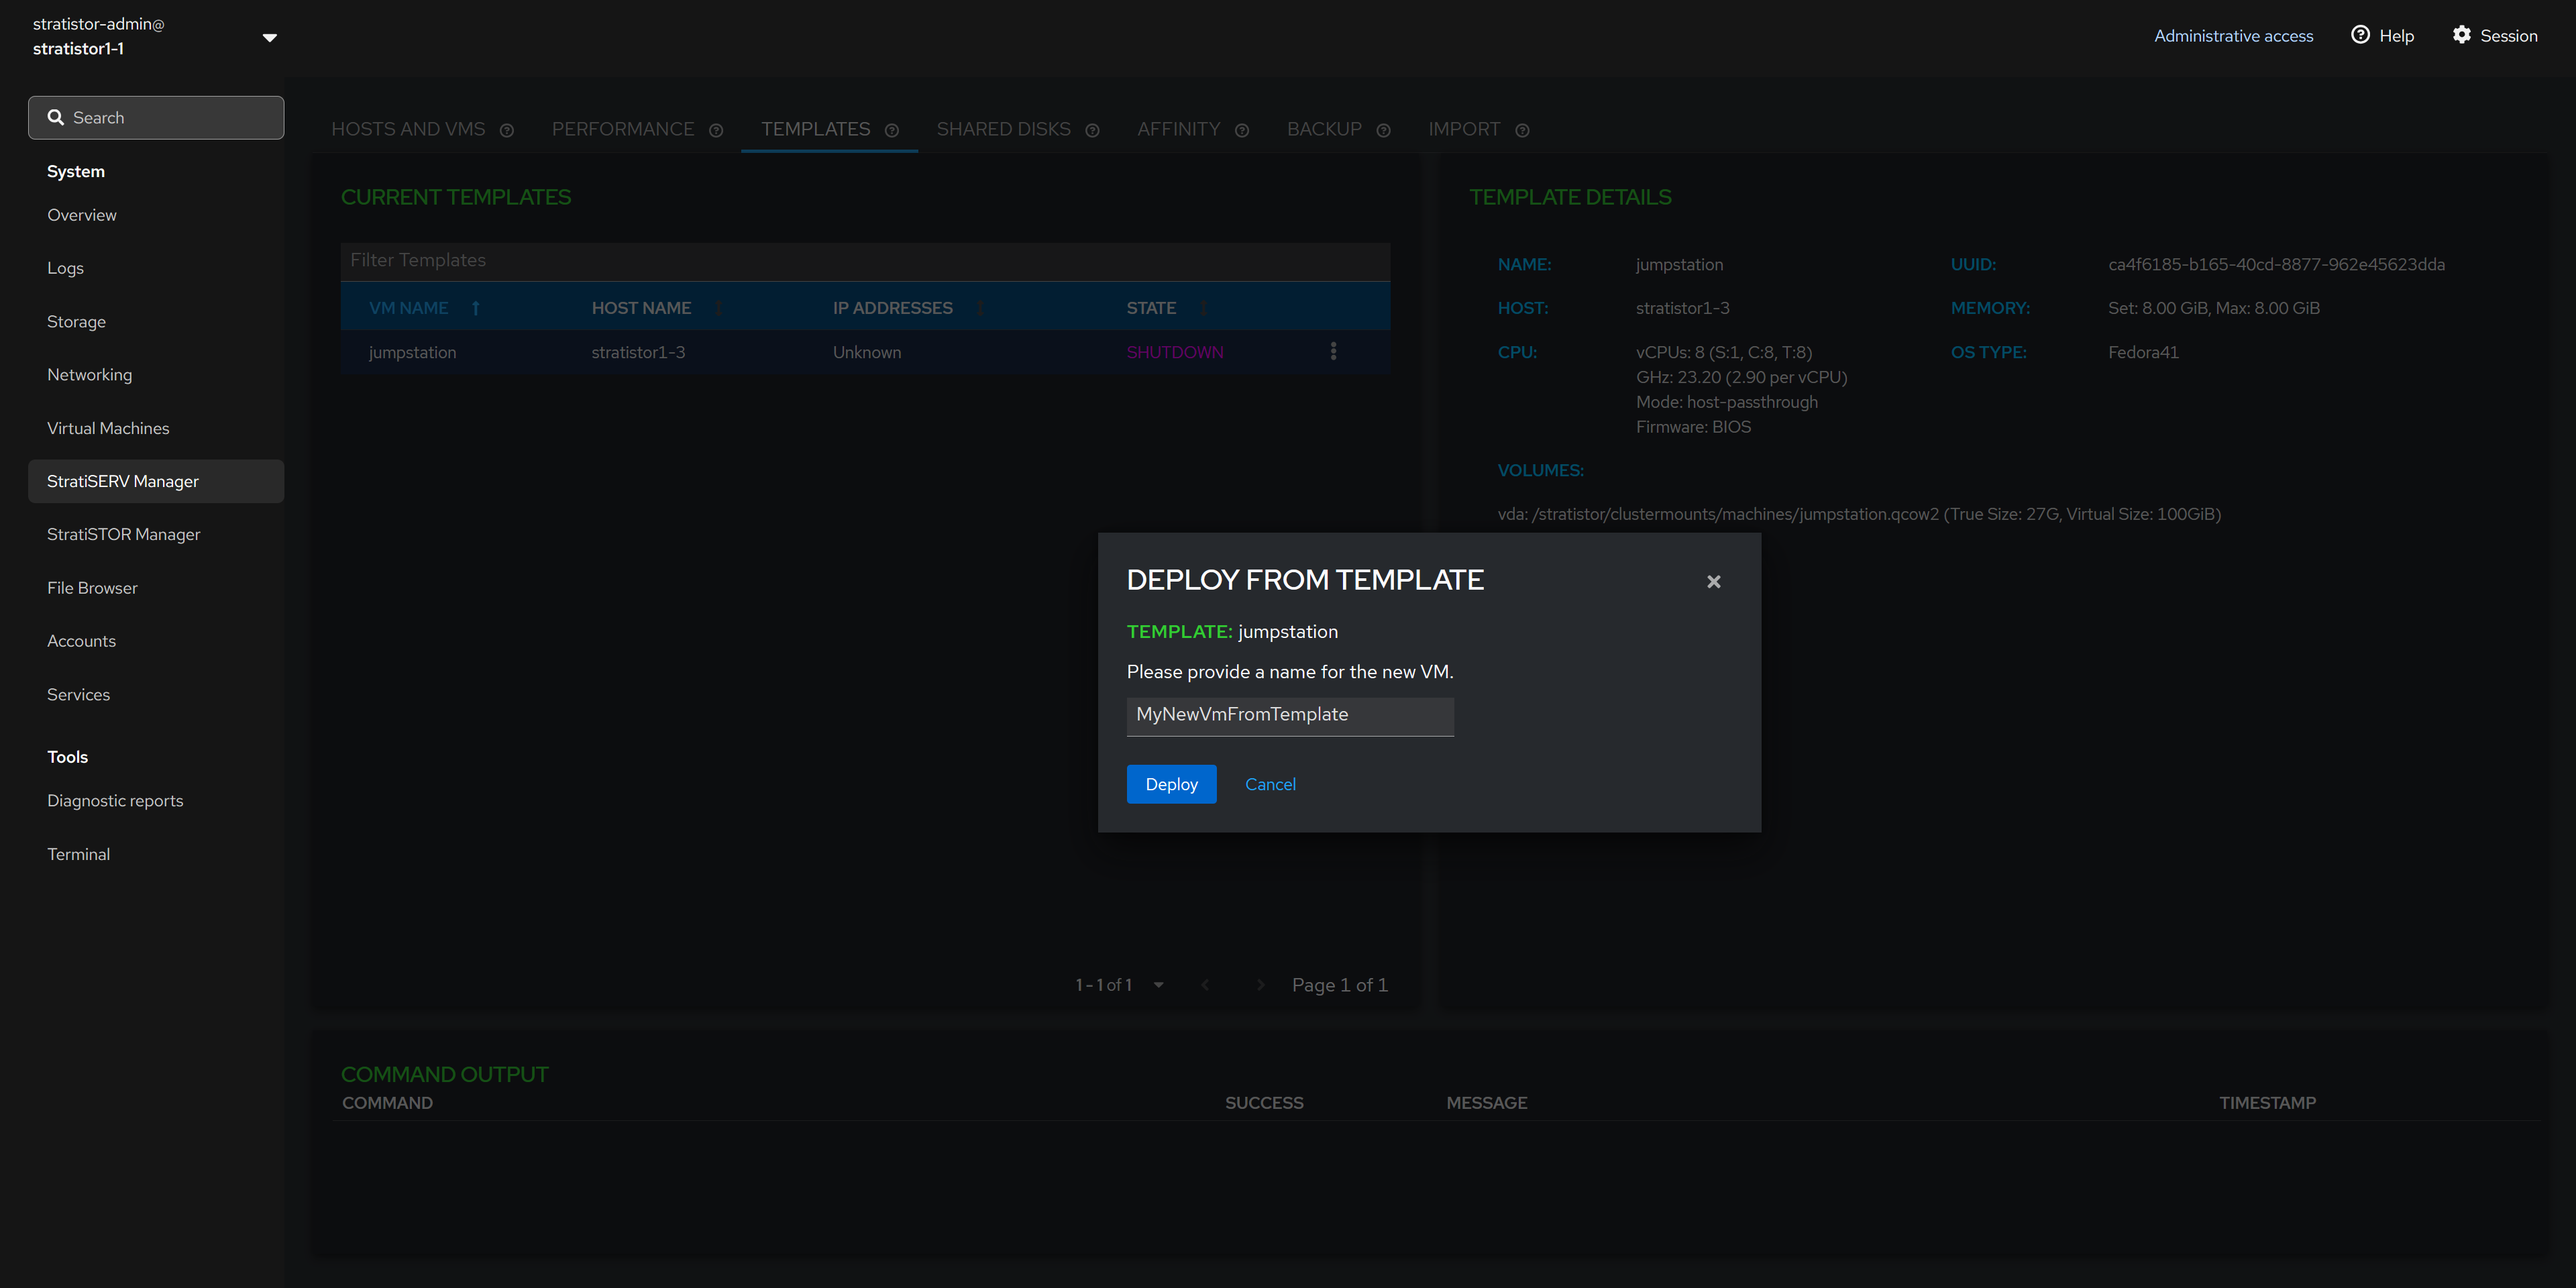
¶ TEMPLATES
If there are any VMs which have been designated as templates, they will appear in the Current Templates table in the left pane. Clicking on the template will display the template details in the right pane.
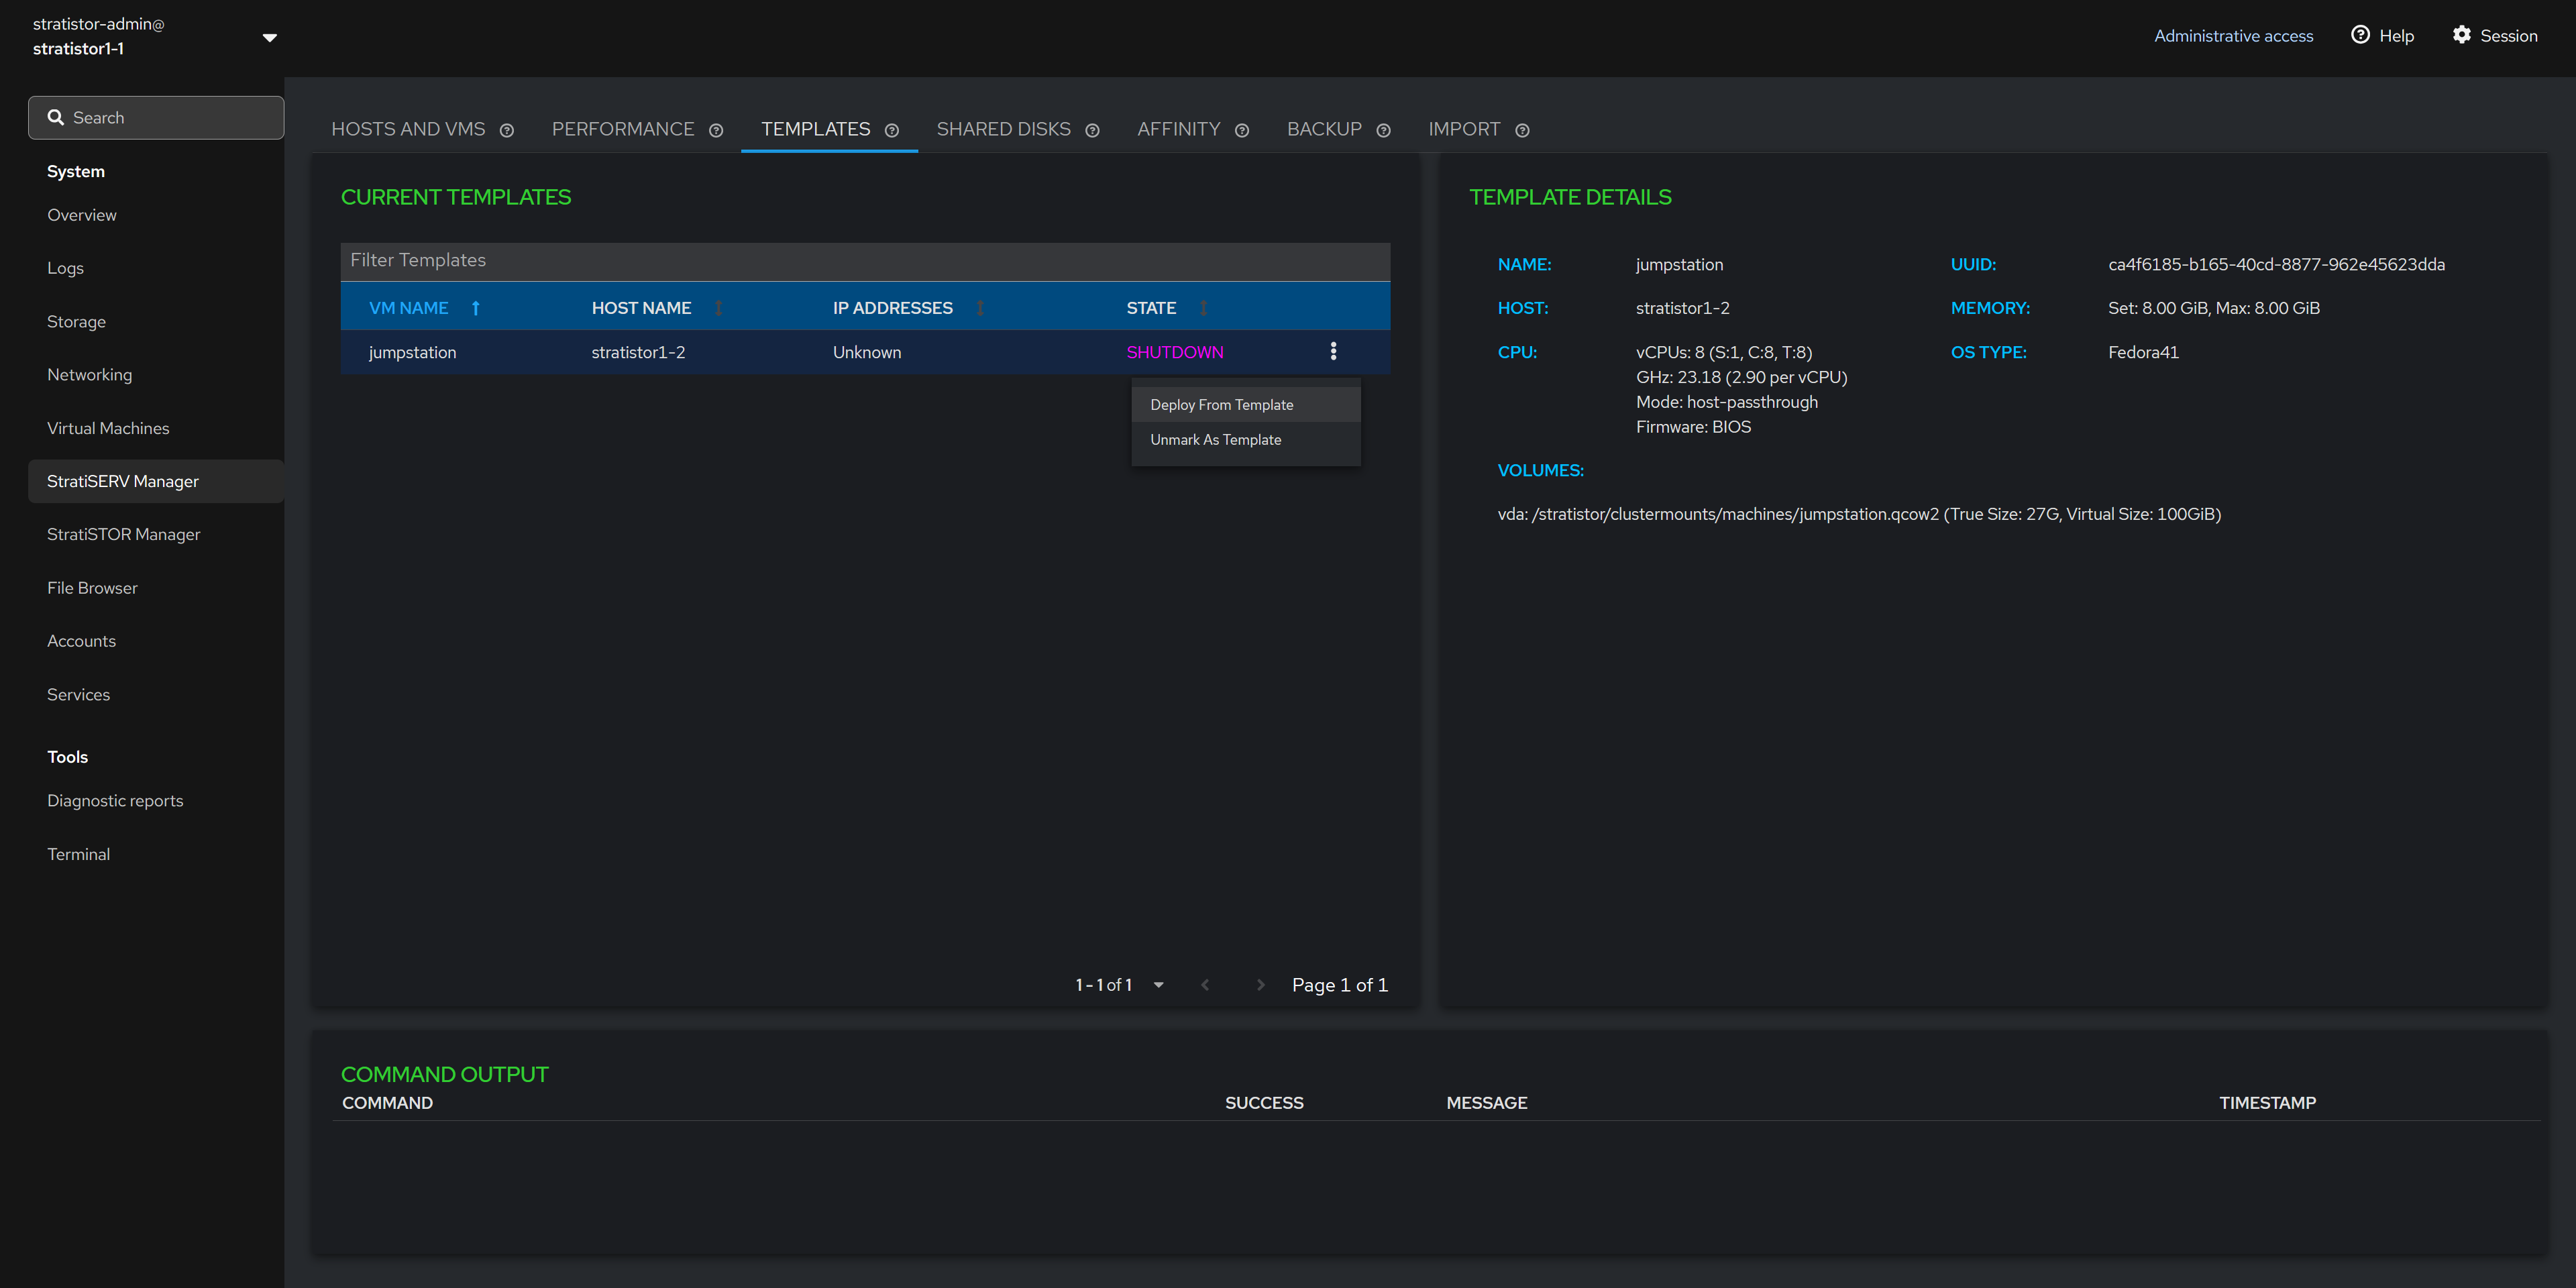
There is an action button (┆) associated with each template which allows the administrator to either deploy a new VM from the template or to unregister the image as a template.
Unregistering the VM as a template will remove it from the templates table and return the VM back to the standard VM inventory which can be accessed from the HOSTS AND VMS tab.
¶ DEPLOY FROM TEMPLATE
If deploying from a template, you will be asked to provide a unique name for the VM that is created from this template. When ready to proceed, click on the DEPLOY button.
Deploying from template supports file and block-based (RBD) disk image types.
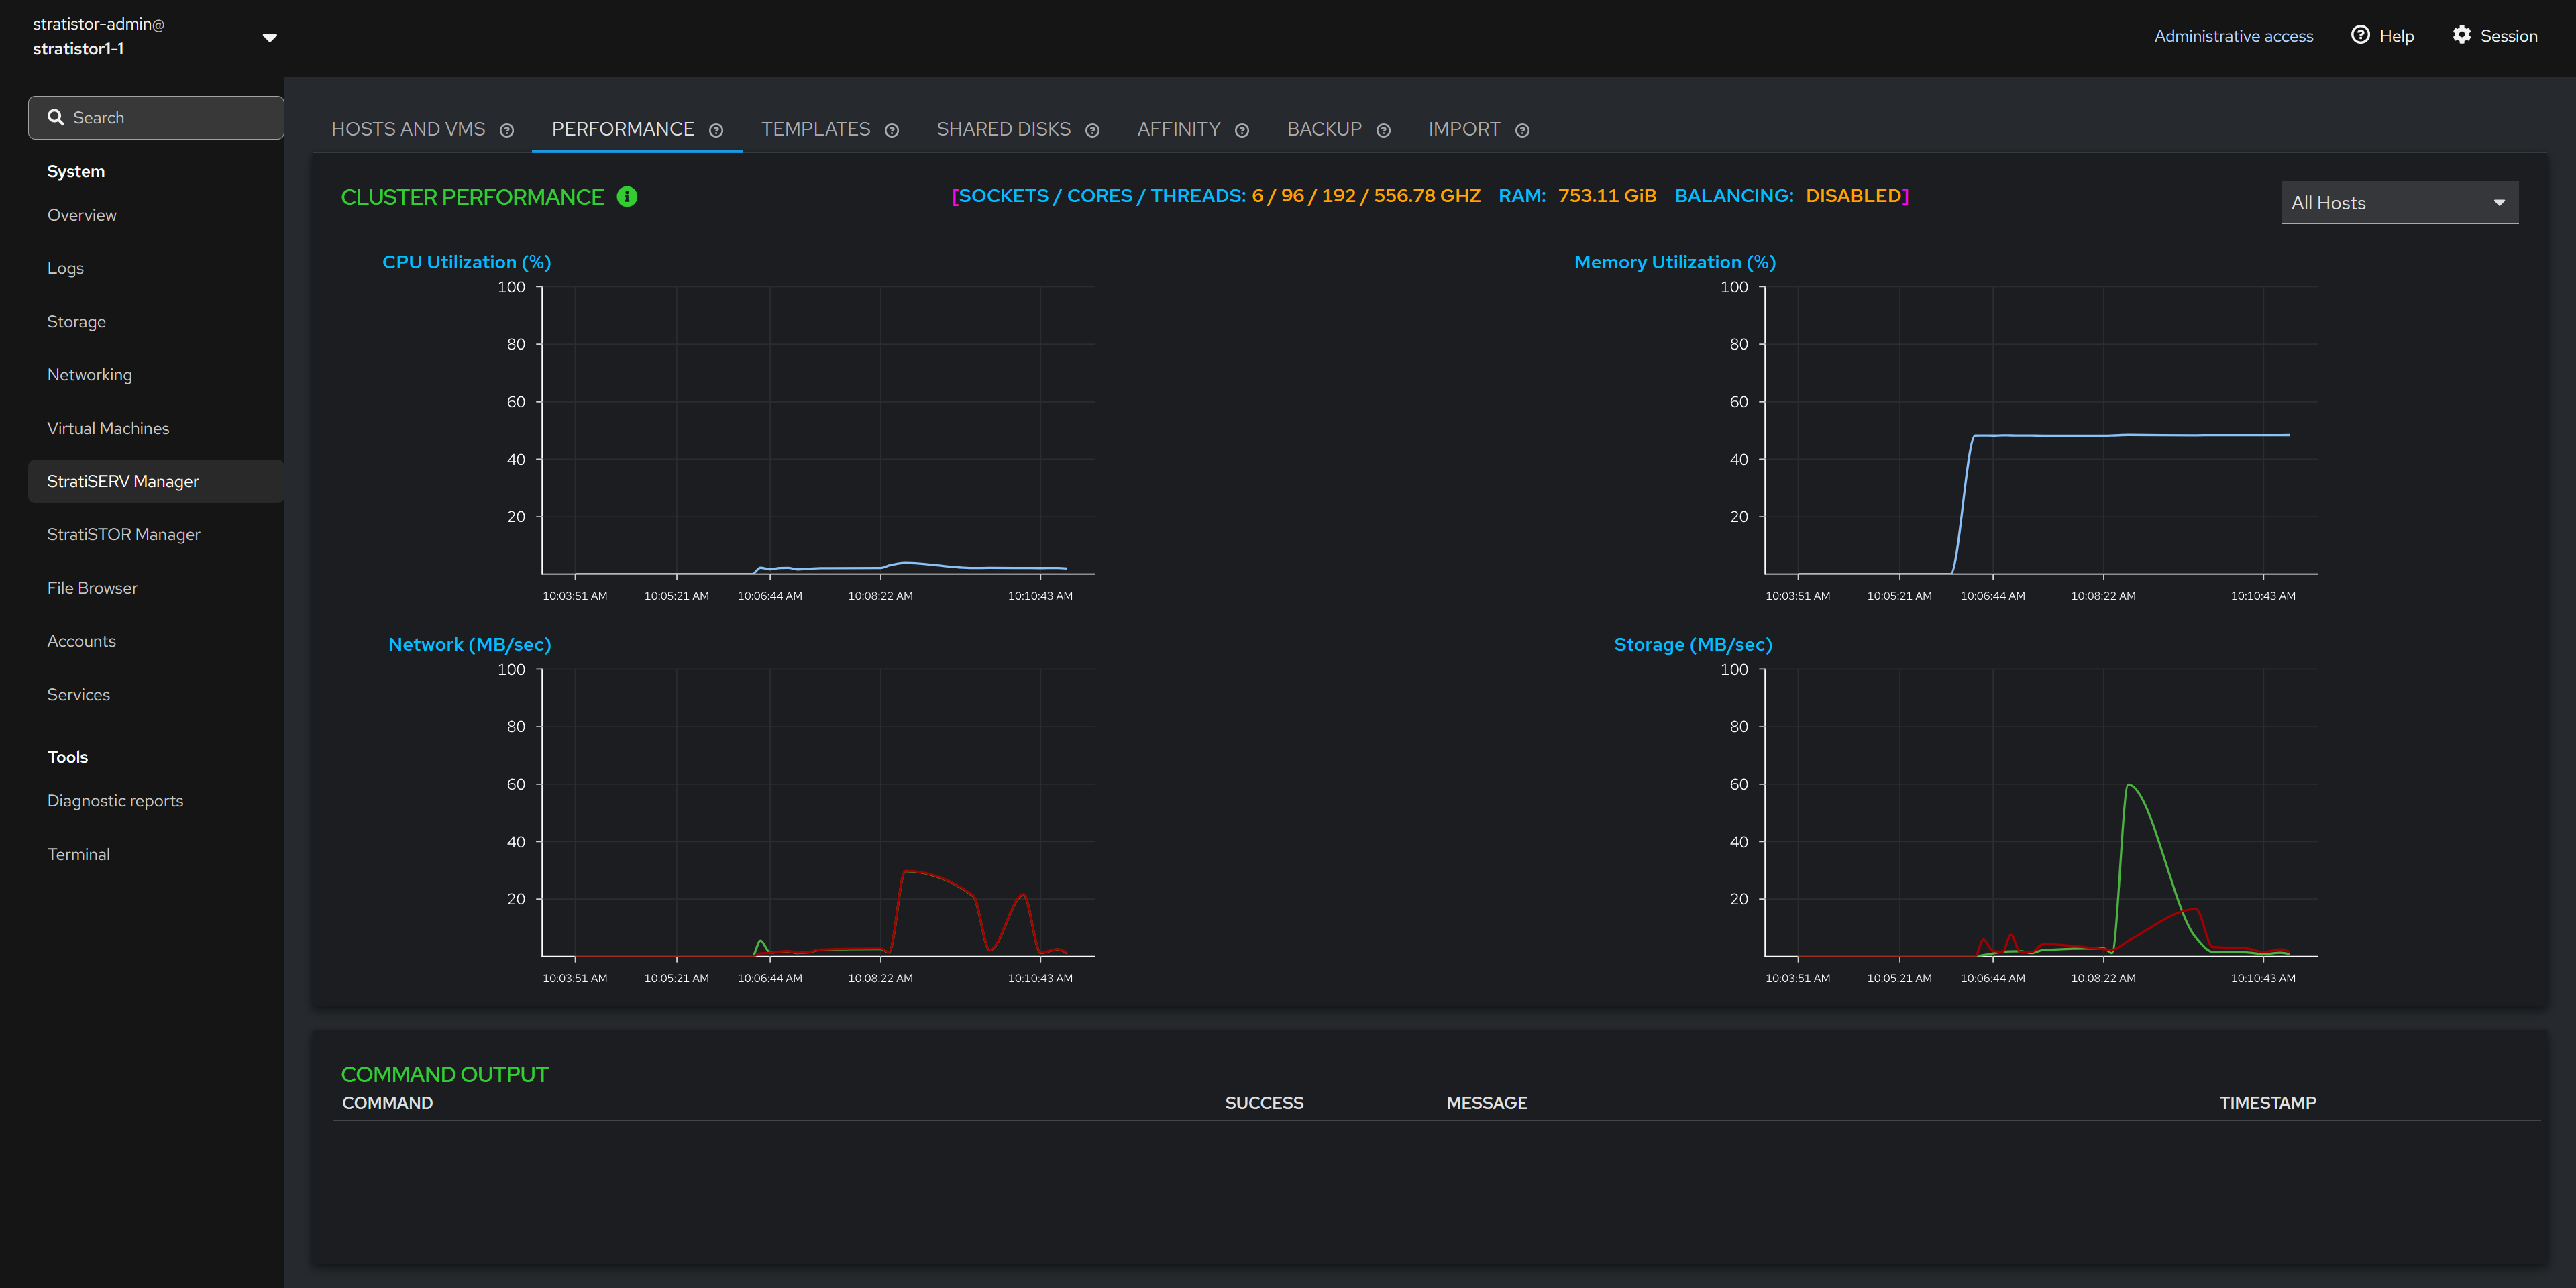
¶ PERFORMANCE
The performance view provides a real-time cluster-wide view of performance for CPU, memory, disk, and network. The top center of the performance view shows the total number of CPU cores and threads, RAM and whether resource scheduling is enabled.
In the upper-right corner of the performance view, there is a server selector which allows the operator to select a specific host in the cluster. This will filter the performance data shown in the graphs to this specific host.
¶ PERFORMANCE - RESOURCE SCHEDULER
Next to the Cluster Performance title there is an info icon (i). Clicking on this icon will open the Distributed Resource Scheduler pane. The administrator can enable the scheduler to monitor the cluster hosts for CPU and/or memory pressure. If CPU and/or memory pressure thresholds are maintained for a period defined by the aggressiveness value, the cluster will automatically start balancing the VMs workloads out to remove the pressure.
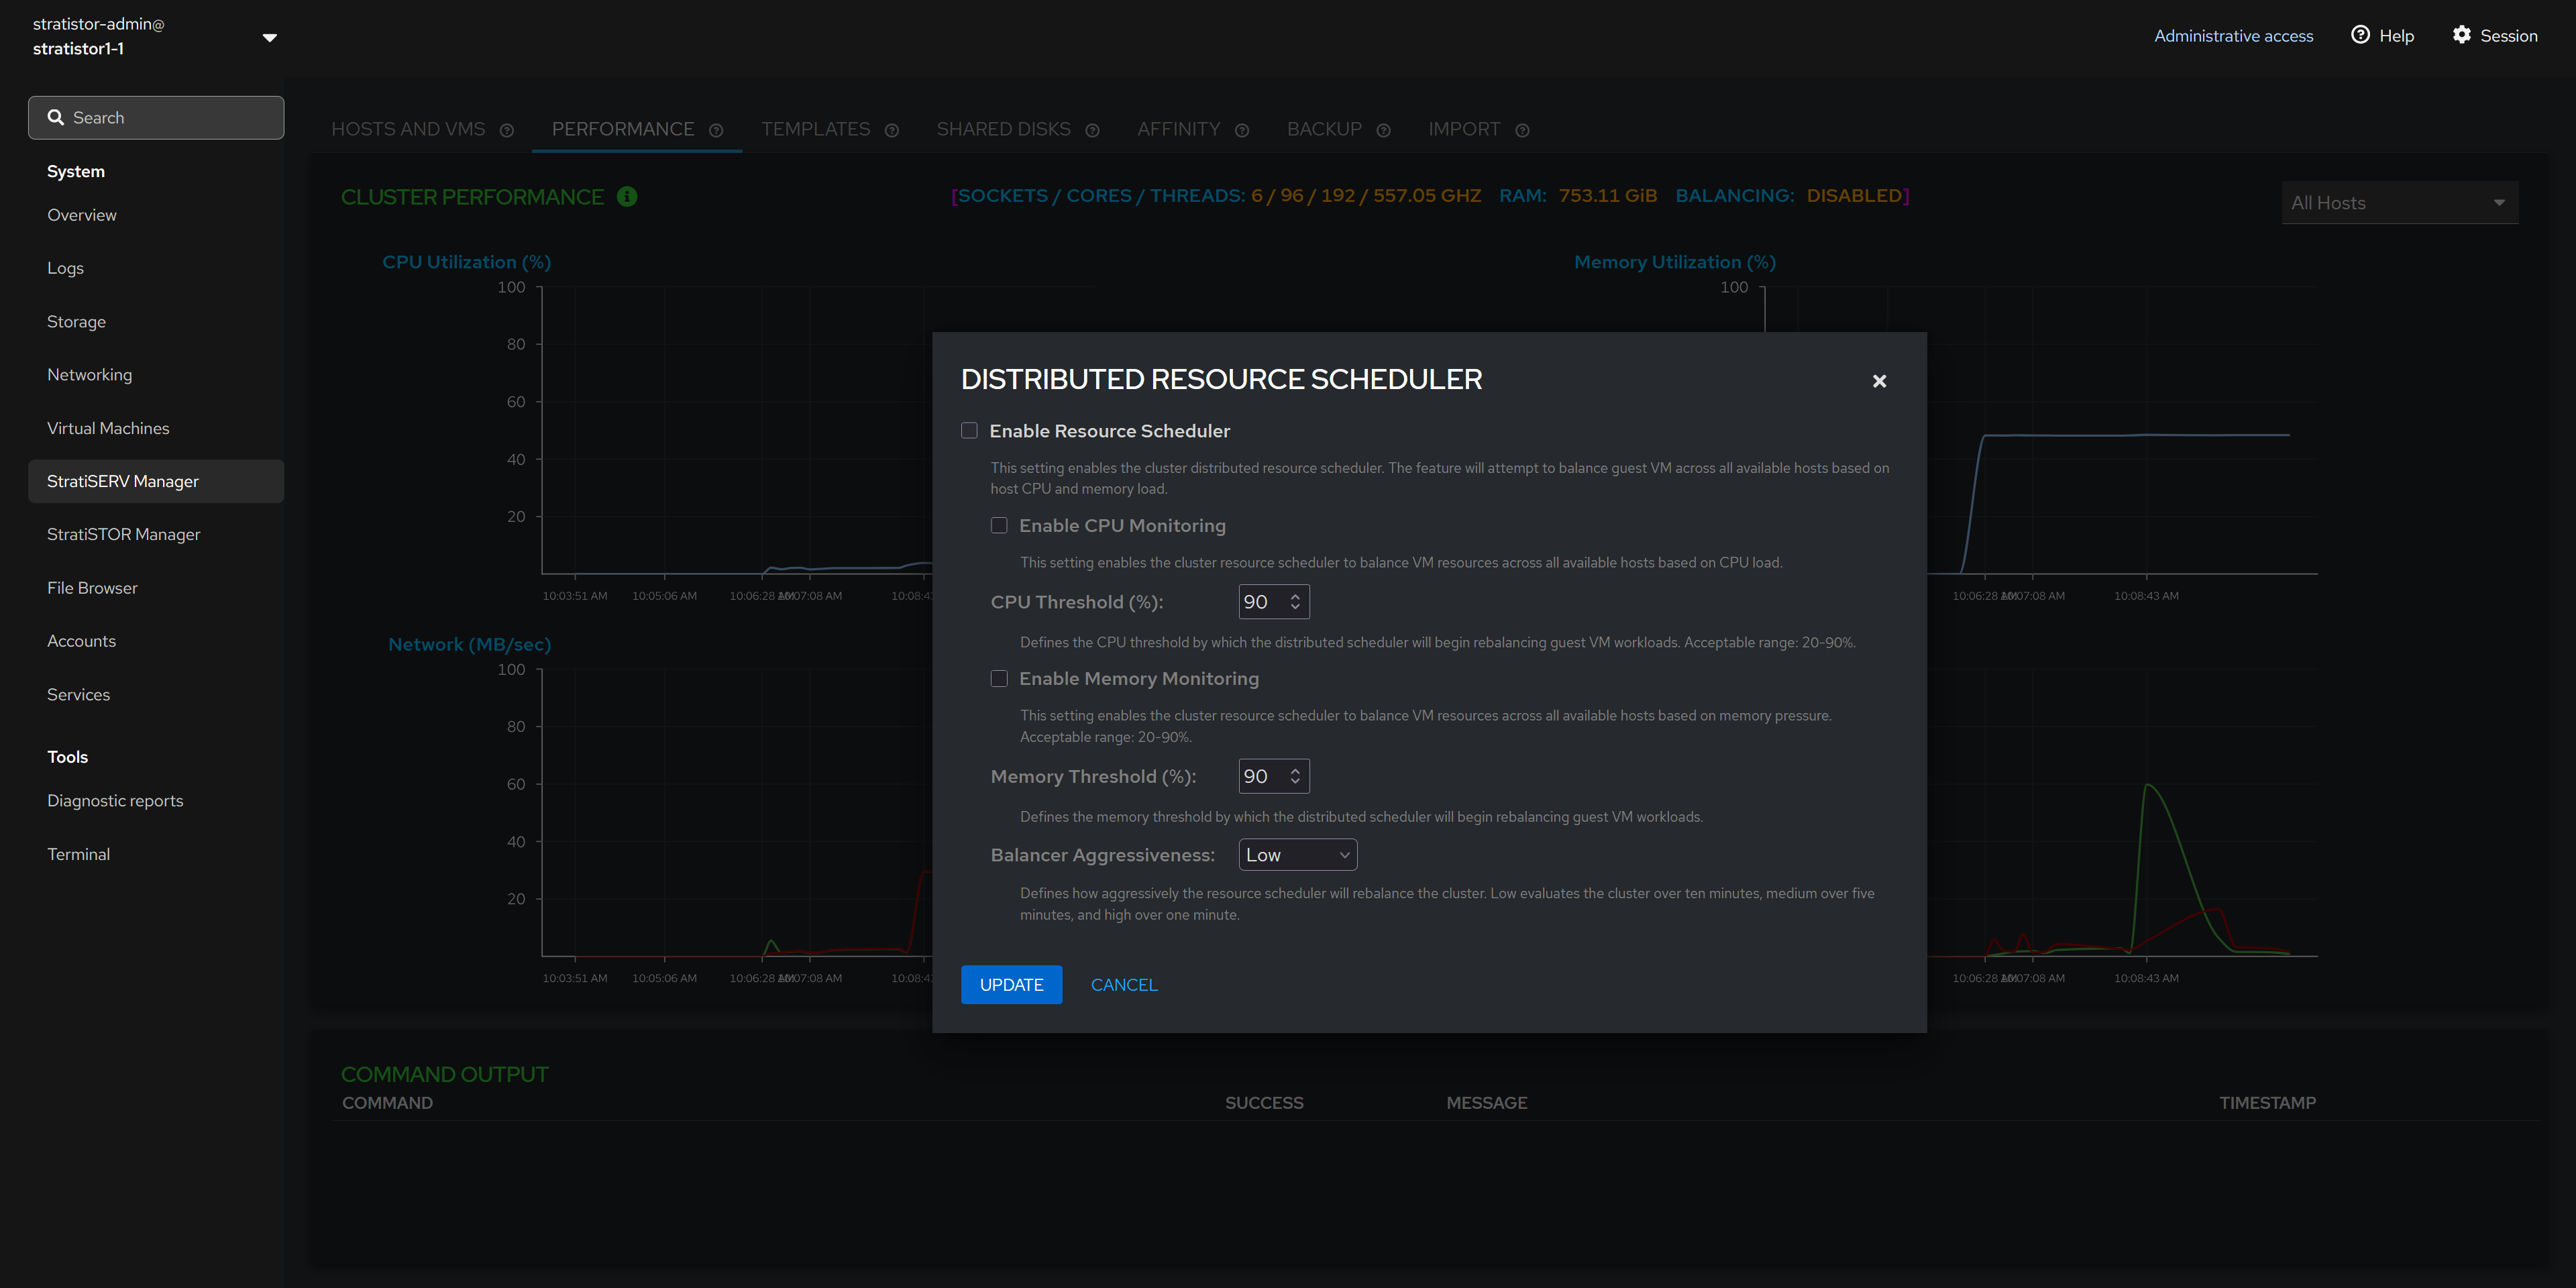
The aggressiveness value determines the time frame by which the pressure is evaluated. Low is over a ten (10) minute period. Medium is over a five (5) minute period and High is over a one (1) minute period.
¶ SHARED DISKS
Shared disks are similar to VMware’s VMFS datastores. They are used when external block storage devices are attached to the cluster hosts such as from a Fibre-channel or iSCSI storage array.
NOTE: If block devices are currently attached and the table is empty, press the RESCAN button to scan all systems for devices. If the table remains empty, then investigate the host connection to the array.

¶ SHARED DISKS - CREATE FENCE DEVICE
The fence device is used by the cluster software to determine the appropriate actions to take in the event of a failure.
NOTE: It is highly recommended to create a fencing device for each external block storage device/array that is being used as a shared disk (a small 1GB disk volume is sufficient).

¶ SHARED DISKS - CREATE FILESYSTEM
When at least one fence device exists, the administrator can create a new filesystem. This filesystem is synonymous with a VMware datastore where the VMs will reside.

Click on the action button (┆) for the block device you want to use as a datastore for VMs and select Create Filesystem.
¶ SHARED DISKS - CREATE FILESYSTEM
To create the cluster filesystem, provide a unique name for the filesystem. The creation process will take 1-2 minutes to complete depending on the size of the volume being prepared.

Once the filesystem creation process has completed, the new filesystem will appear as a storage pool where VMs can now be created and/or migrated to.
¶ SHARED DISKS - STATUS INDICATORS
The green colored host names indicate the hosts which are currently using the block device.
The magenta colored host names indicate the hosts which are not currently using the block device.
If there is a block device which contains both green and magenta host names, this indicates that a block device is operational and in use by the green colored hosts, but the magenta colored hosts have not yet been configured to use that device. In this case, you will see an additional action item named Extend Filesystem. Selecting this option will activate the block device on the remaining hosts.

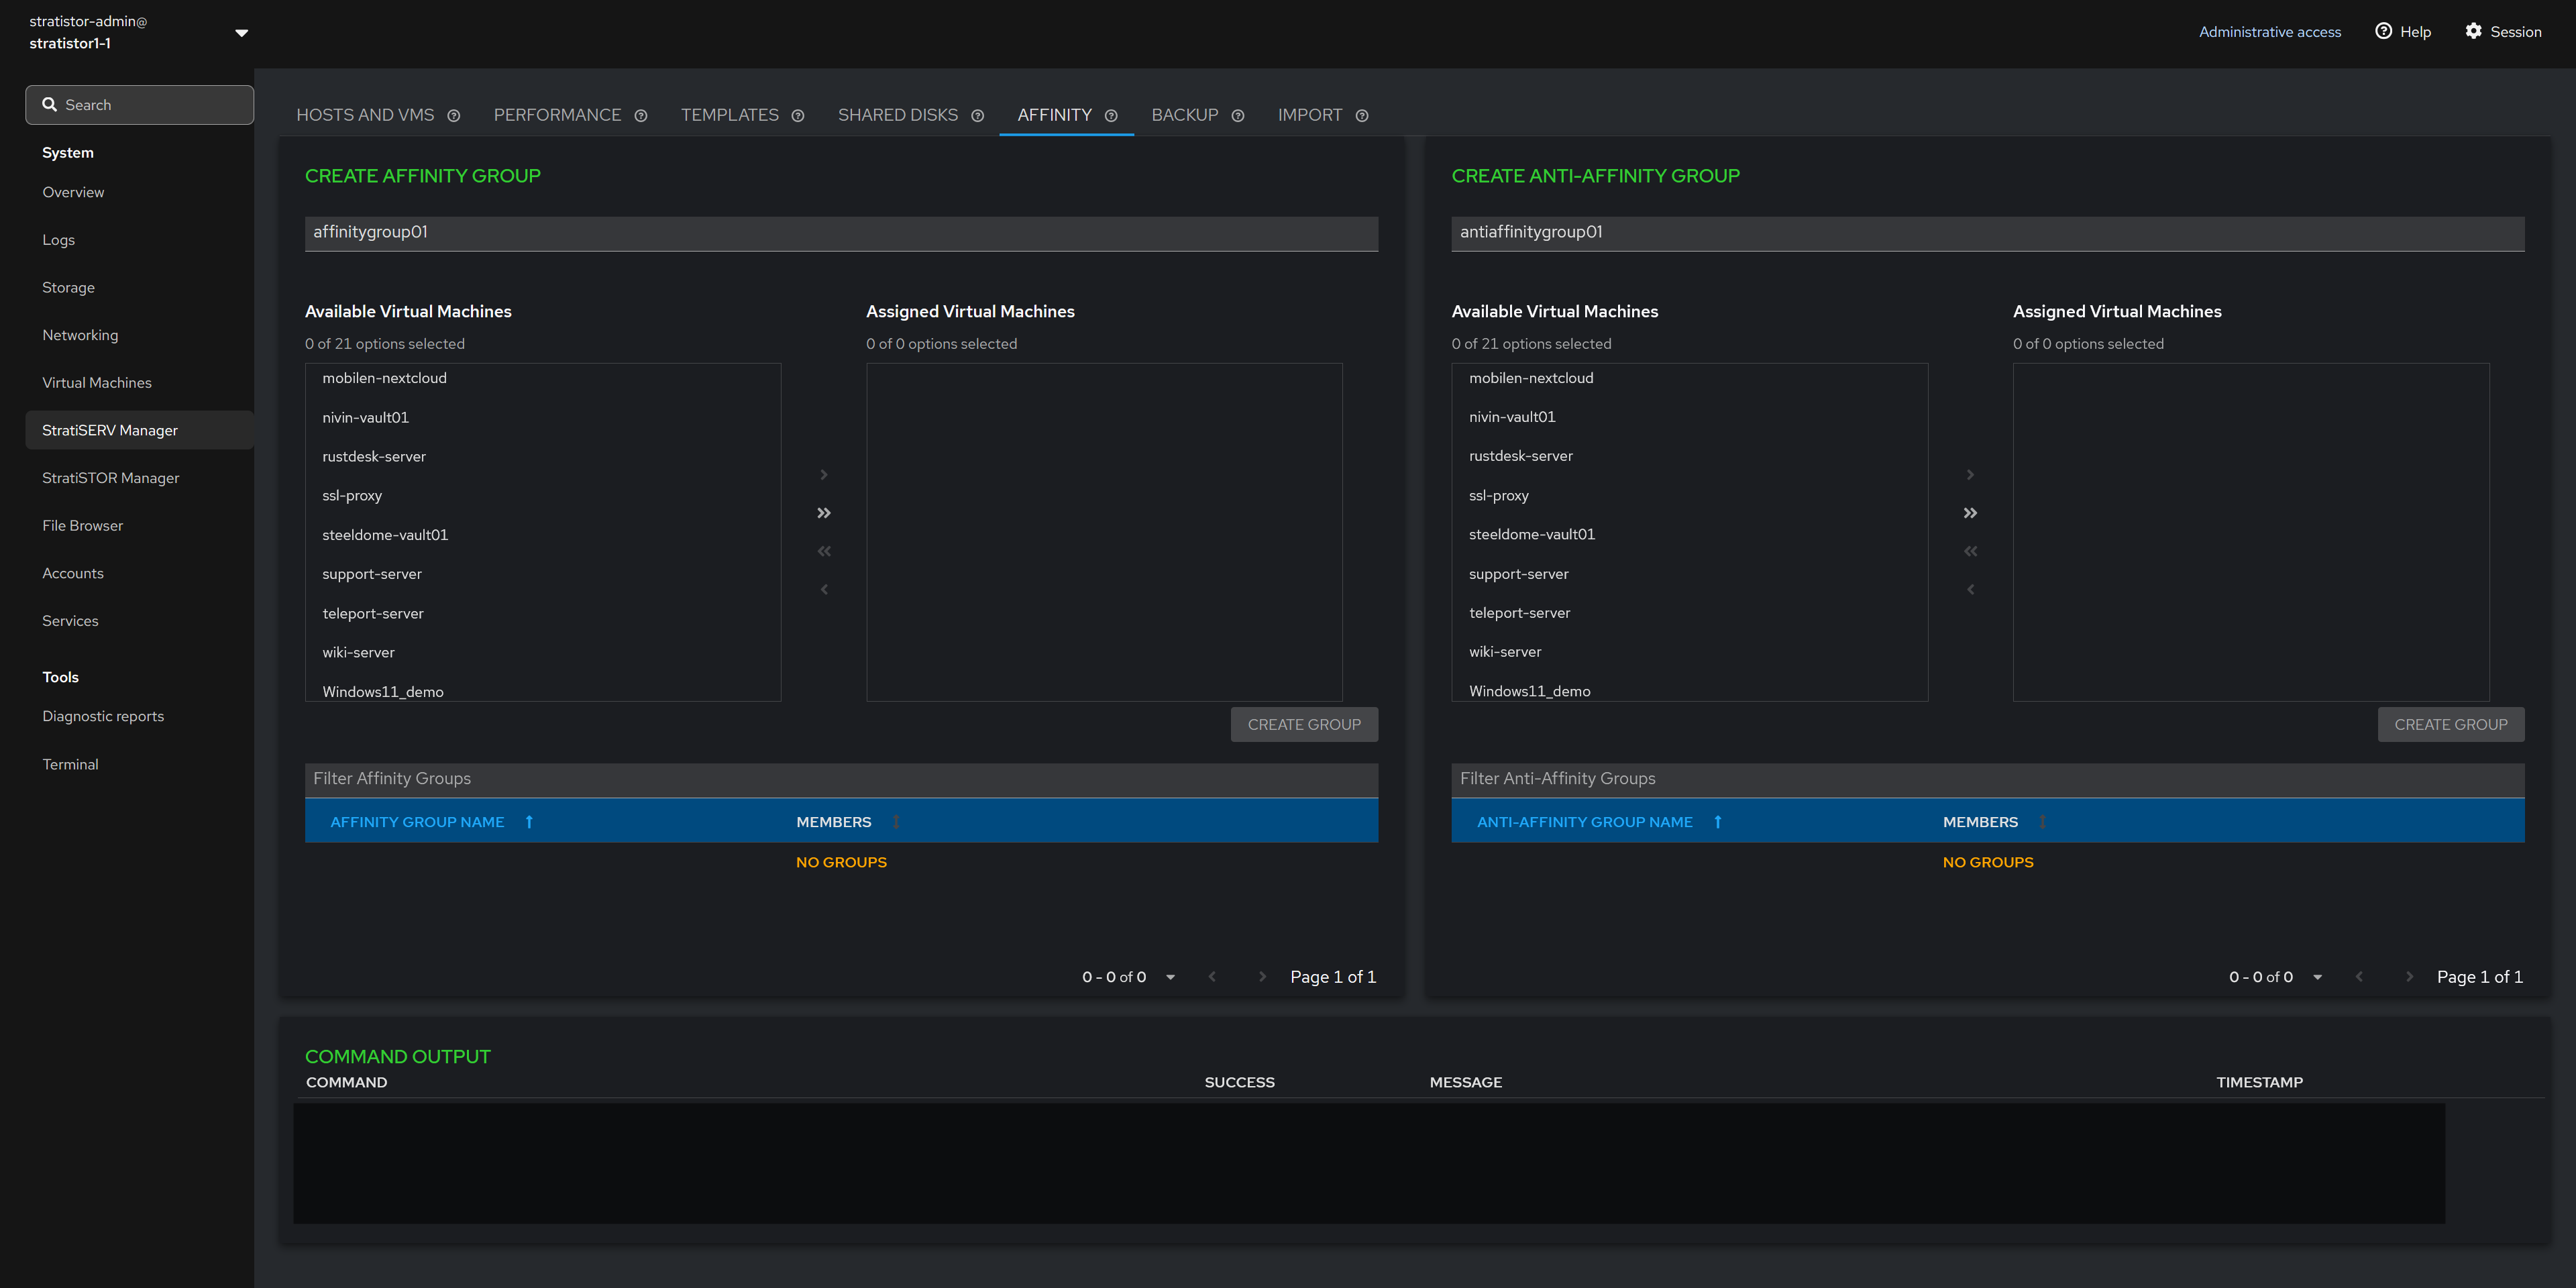
¶ AFFINITY GROUPS
Affinity groups can be defined which contain two or more VMs. Affinity groups ensure that all VMs in that group will remain together on the same host.
NOTE: The affinities will be maintained even if resource scheduling thresholds are exceeded.
Anti-Affinity groups can be defined which contain two or more VMs. Anti-Affinity groups ensure that all VMs in that group will remain on the different hosts as long as there is a sufficient number of operational hosts to maintain the separation.
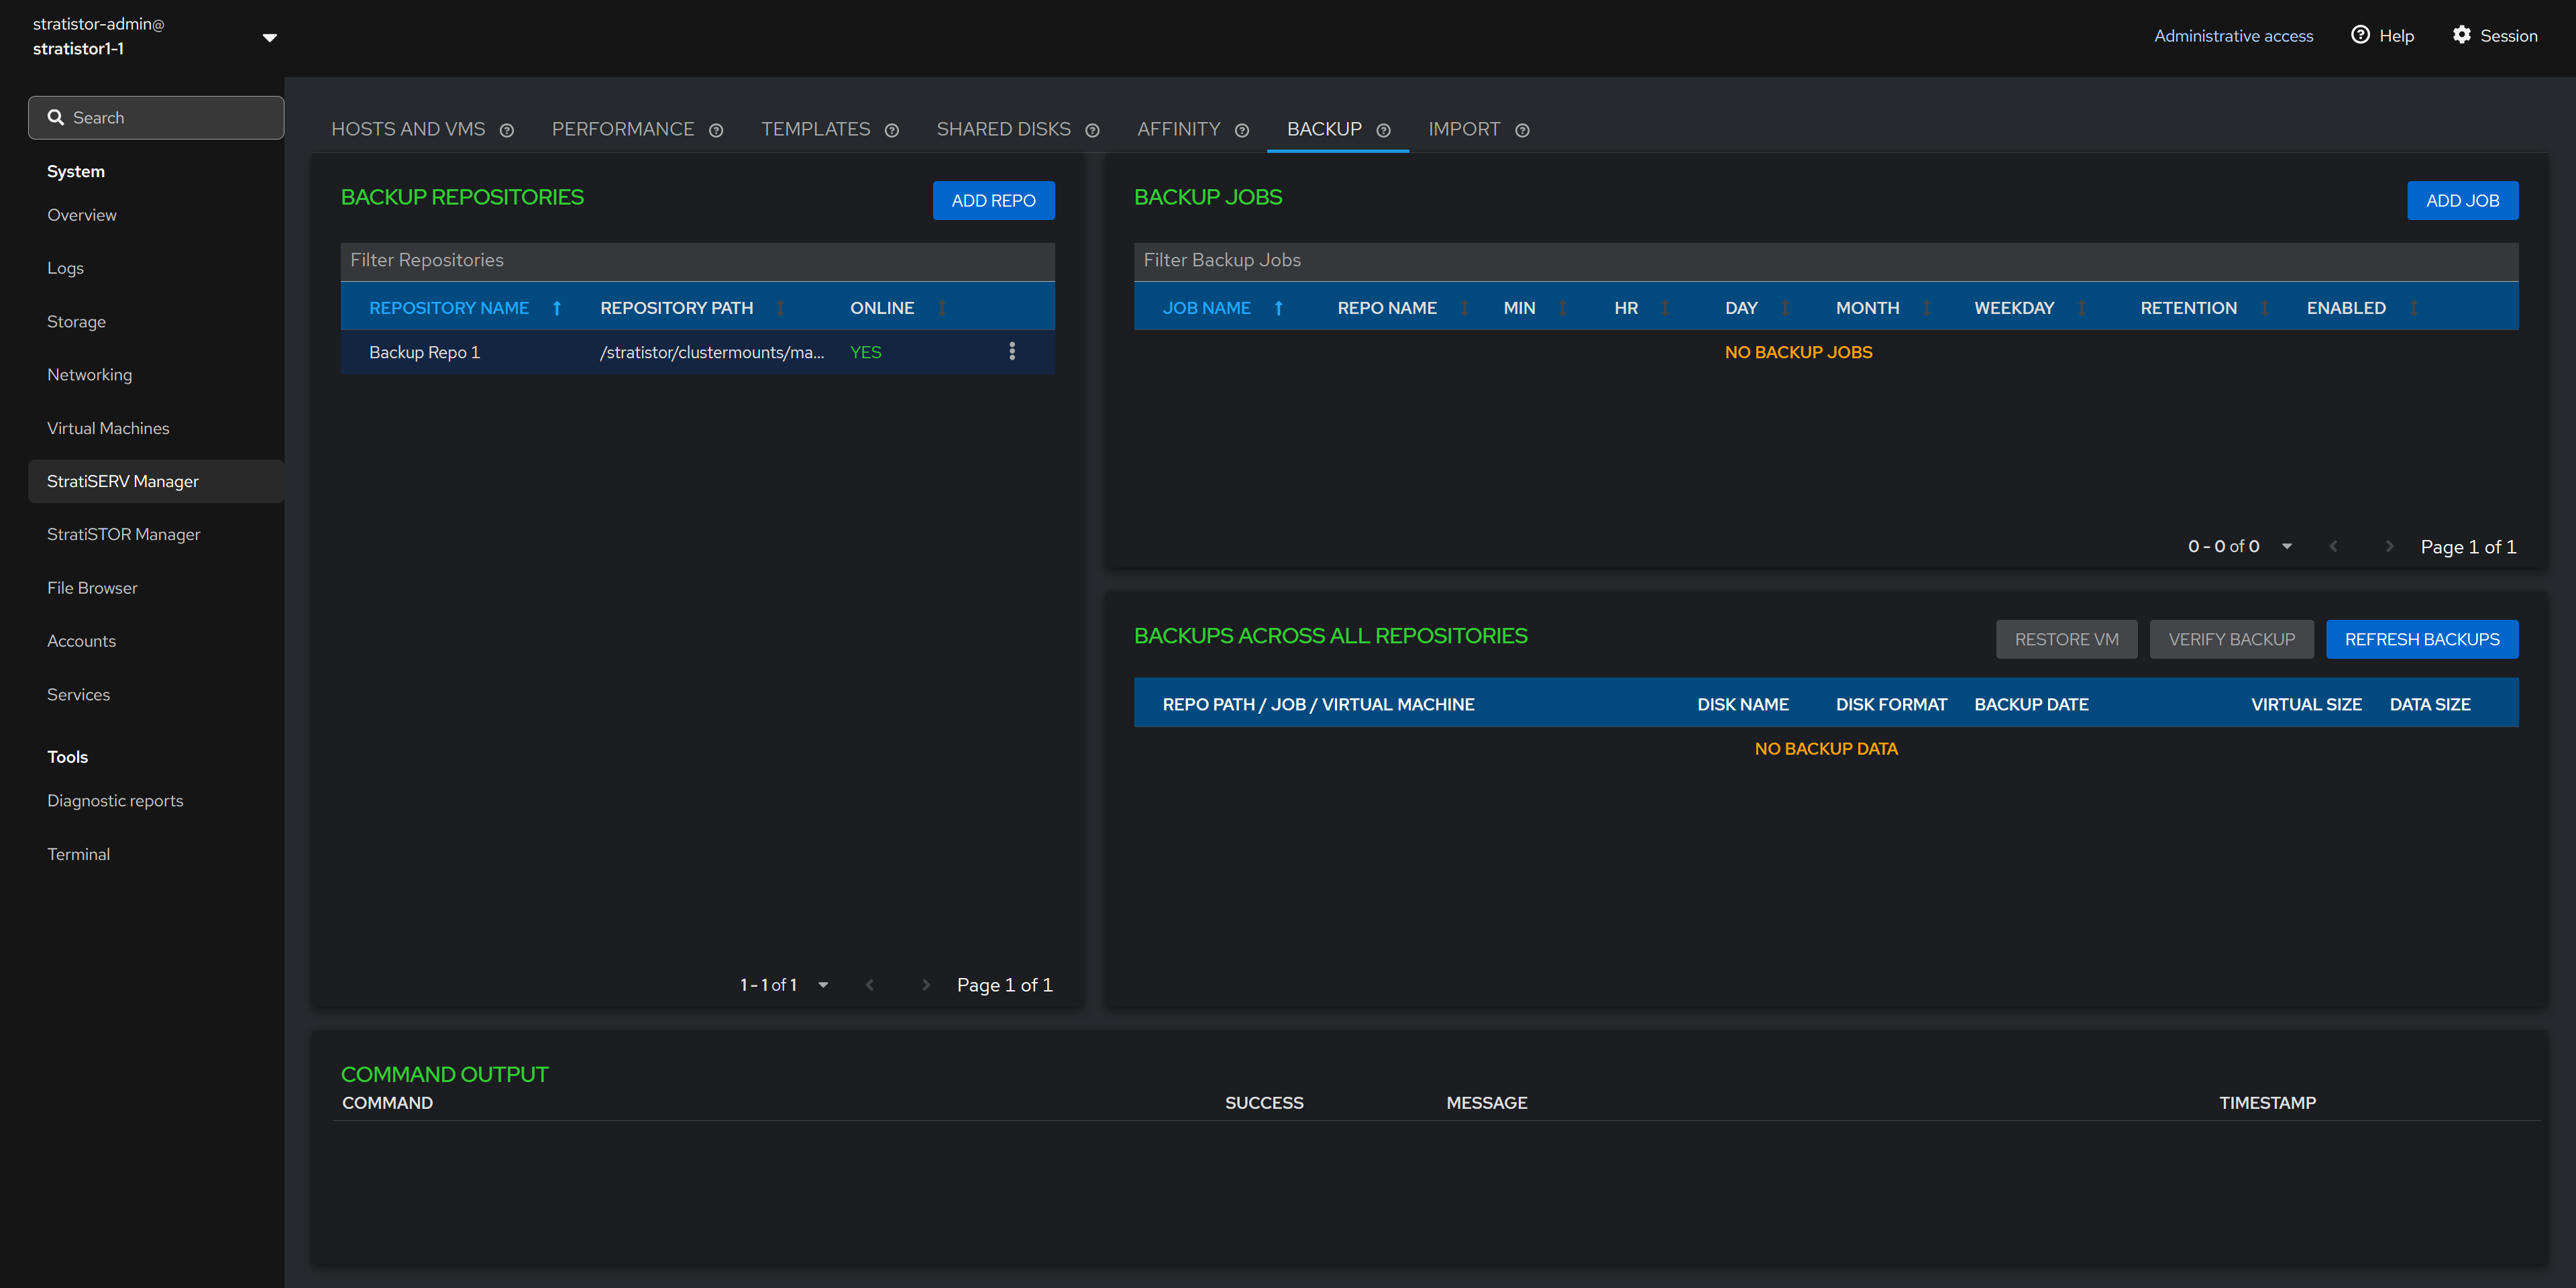
¶ BACKUPS
The backup facilities provide a convenient way to protect the VM data without the use of other third-party software.
At least one backup repository needs to be defined before a backup job can be created. The backup repository is any storage location (local or remotely attached) that the hosts are currently configured to use. This can be block, file or cloud based storage. It is highly recommended that all hosts have access to the same location so that backups can occur no matter which host a VM happens to reside on. If the repository is only available on certain hosts, this will be indicated by the Online column showing PARTIAL instead of YES.
¶ BACKUP - REPOSITORIES
To add a new repository click on the ADD REPO button. Provide a unique name and location for the repository. When ready, click ADD to complete the process.
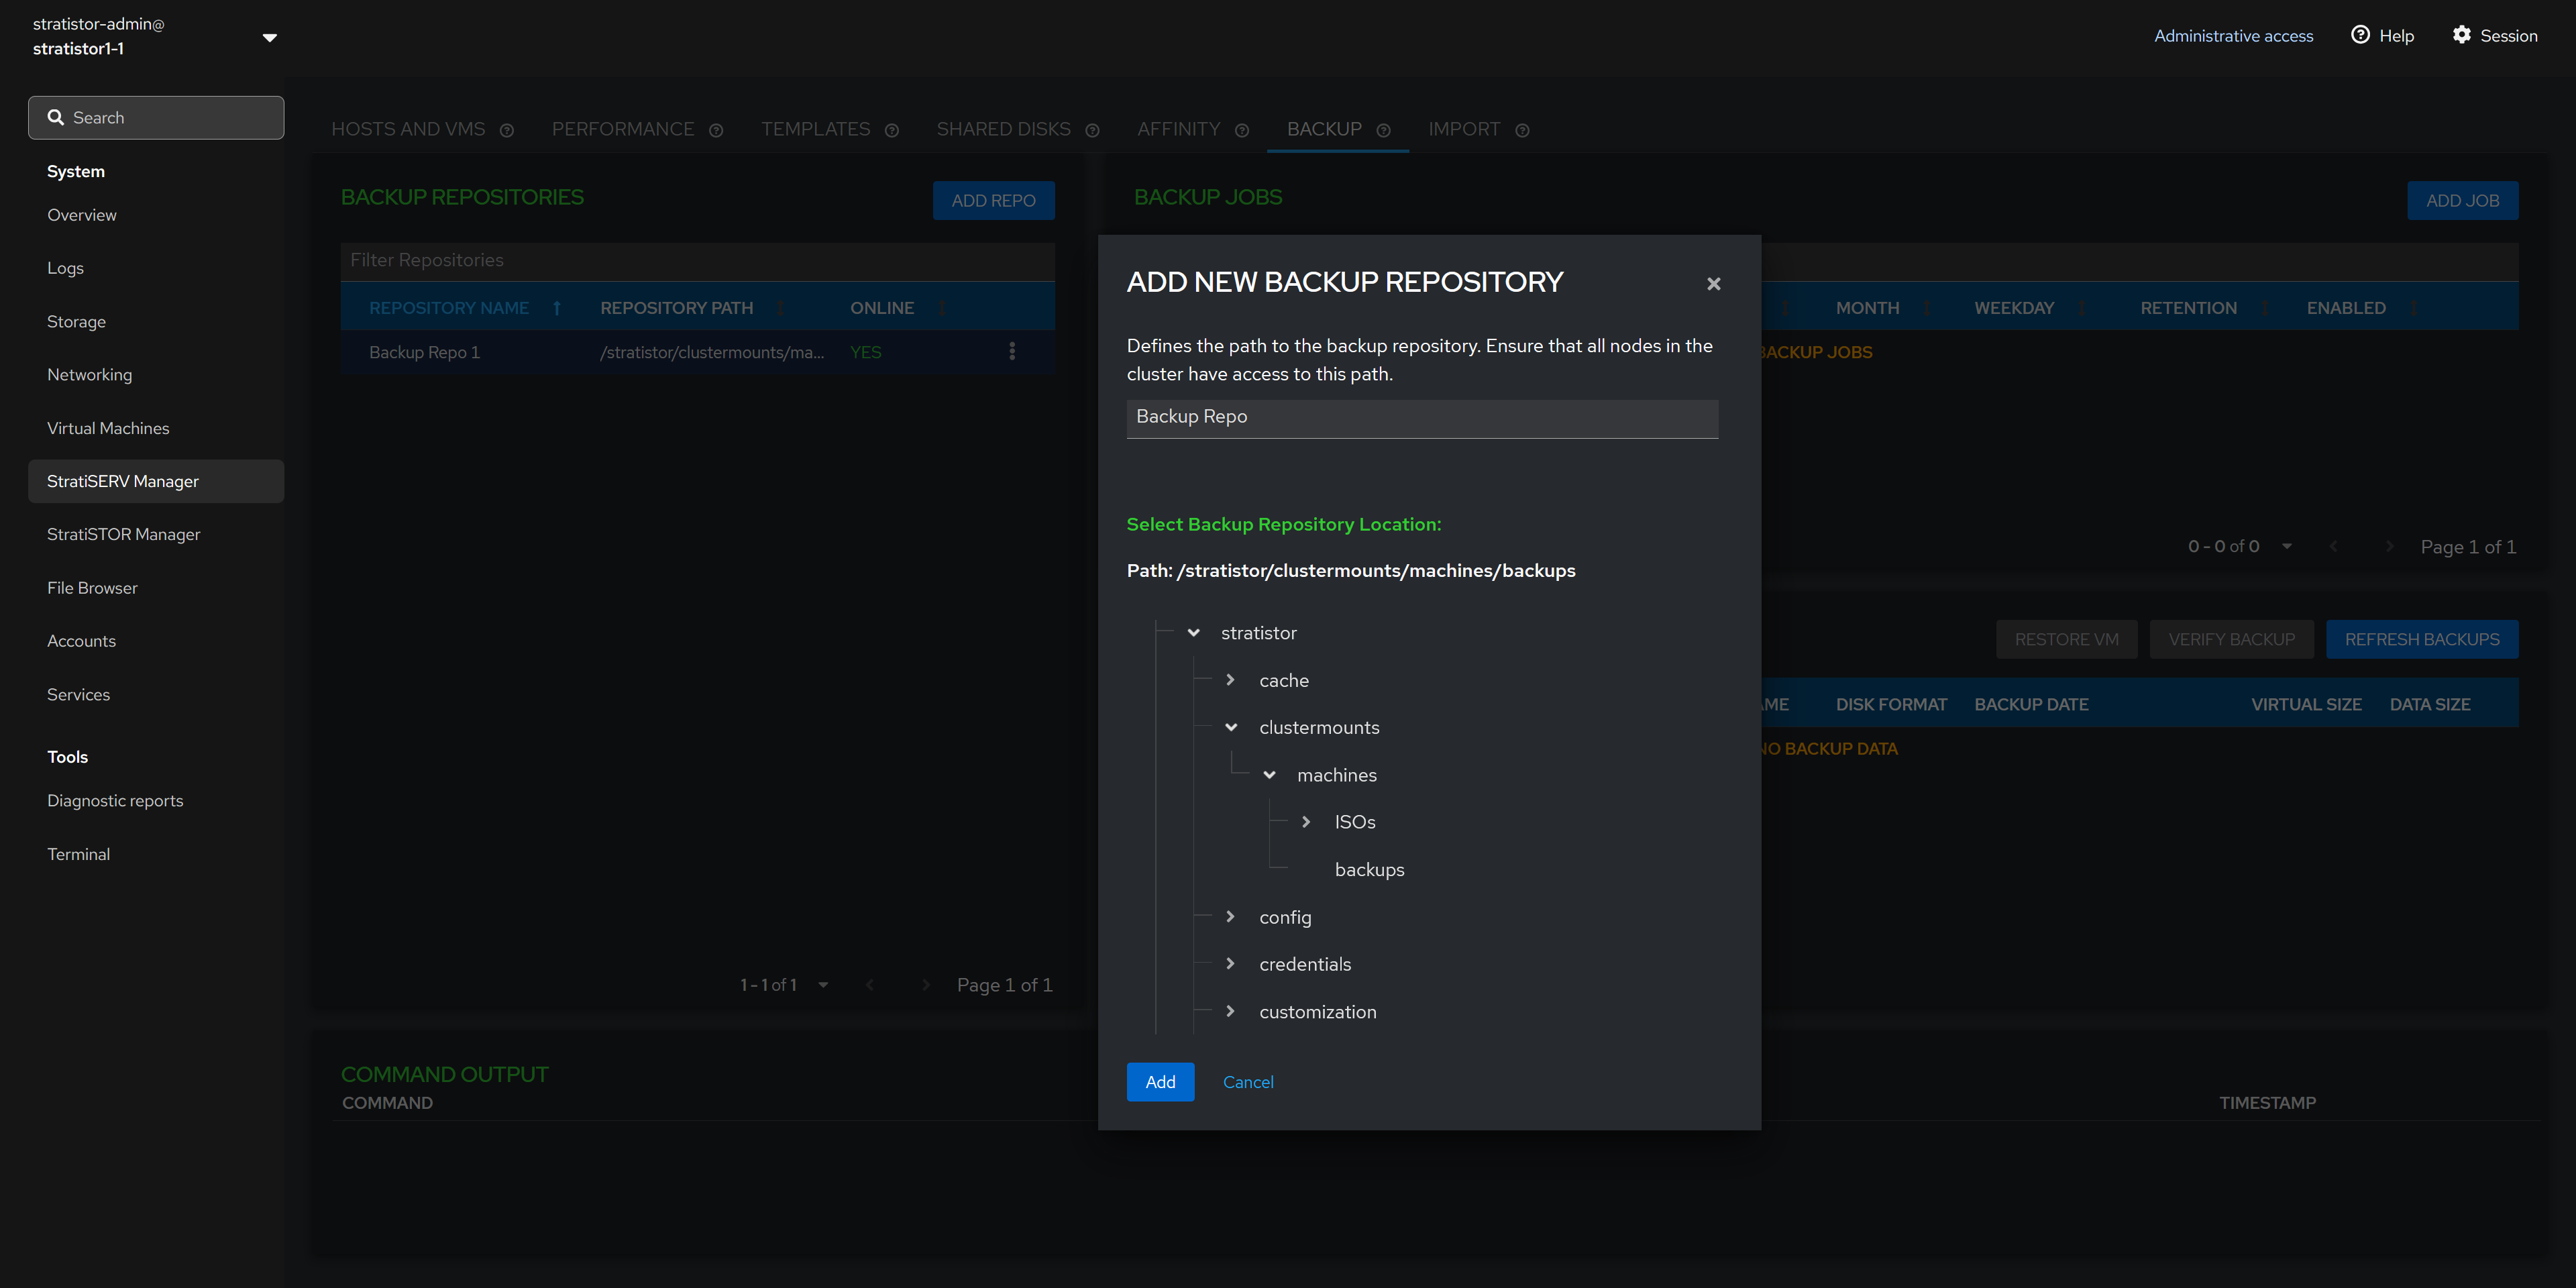
NOTE: Numerous repository types can be attached to the system including any block device, file sharing device, or any of 35+ cloud providers including Akamai, Amazon S3, Backblaze, Box, Citrix ShareFile, Dropbox, Google Cloud Storage, Microsoft Azure Blob/Files, OpenStack platforms, and Proton Drive.
¶ BACKUP - ADD NEW BACKUP JOB
Now that a backup repository exists, you can create a new backup job by clicking on the ADD JOB button. This will invoke the new backup job view.
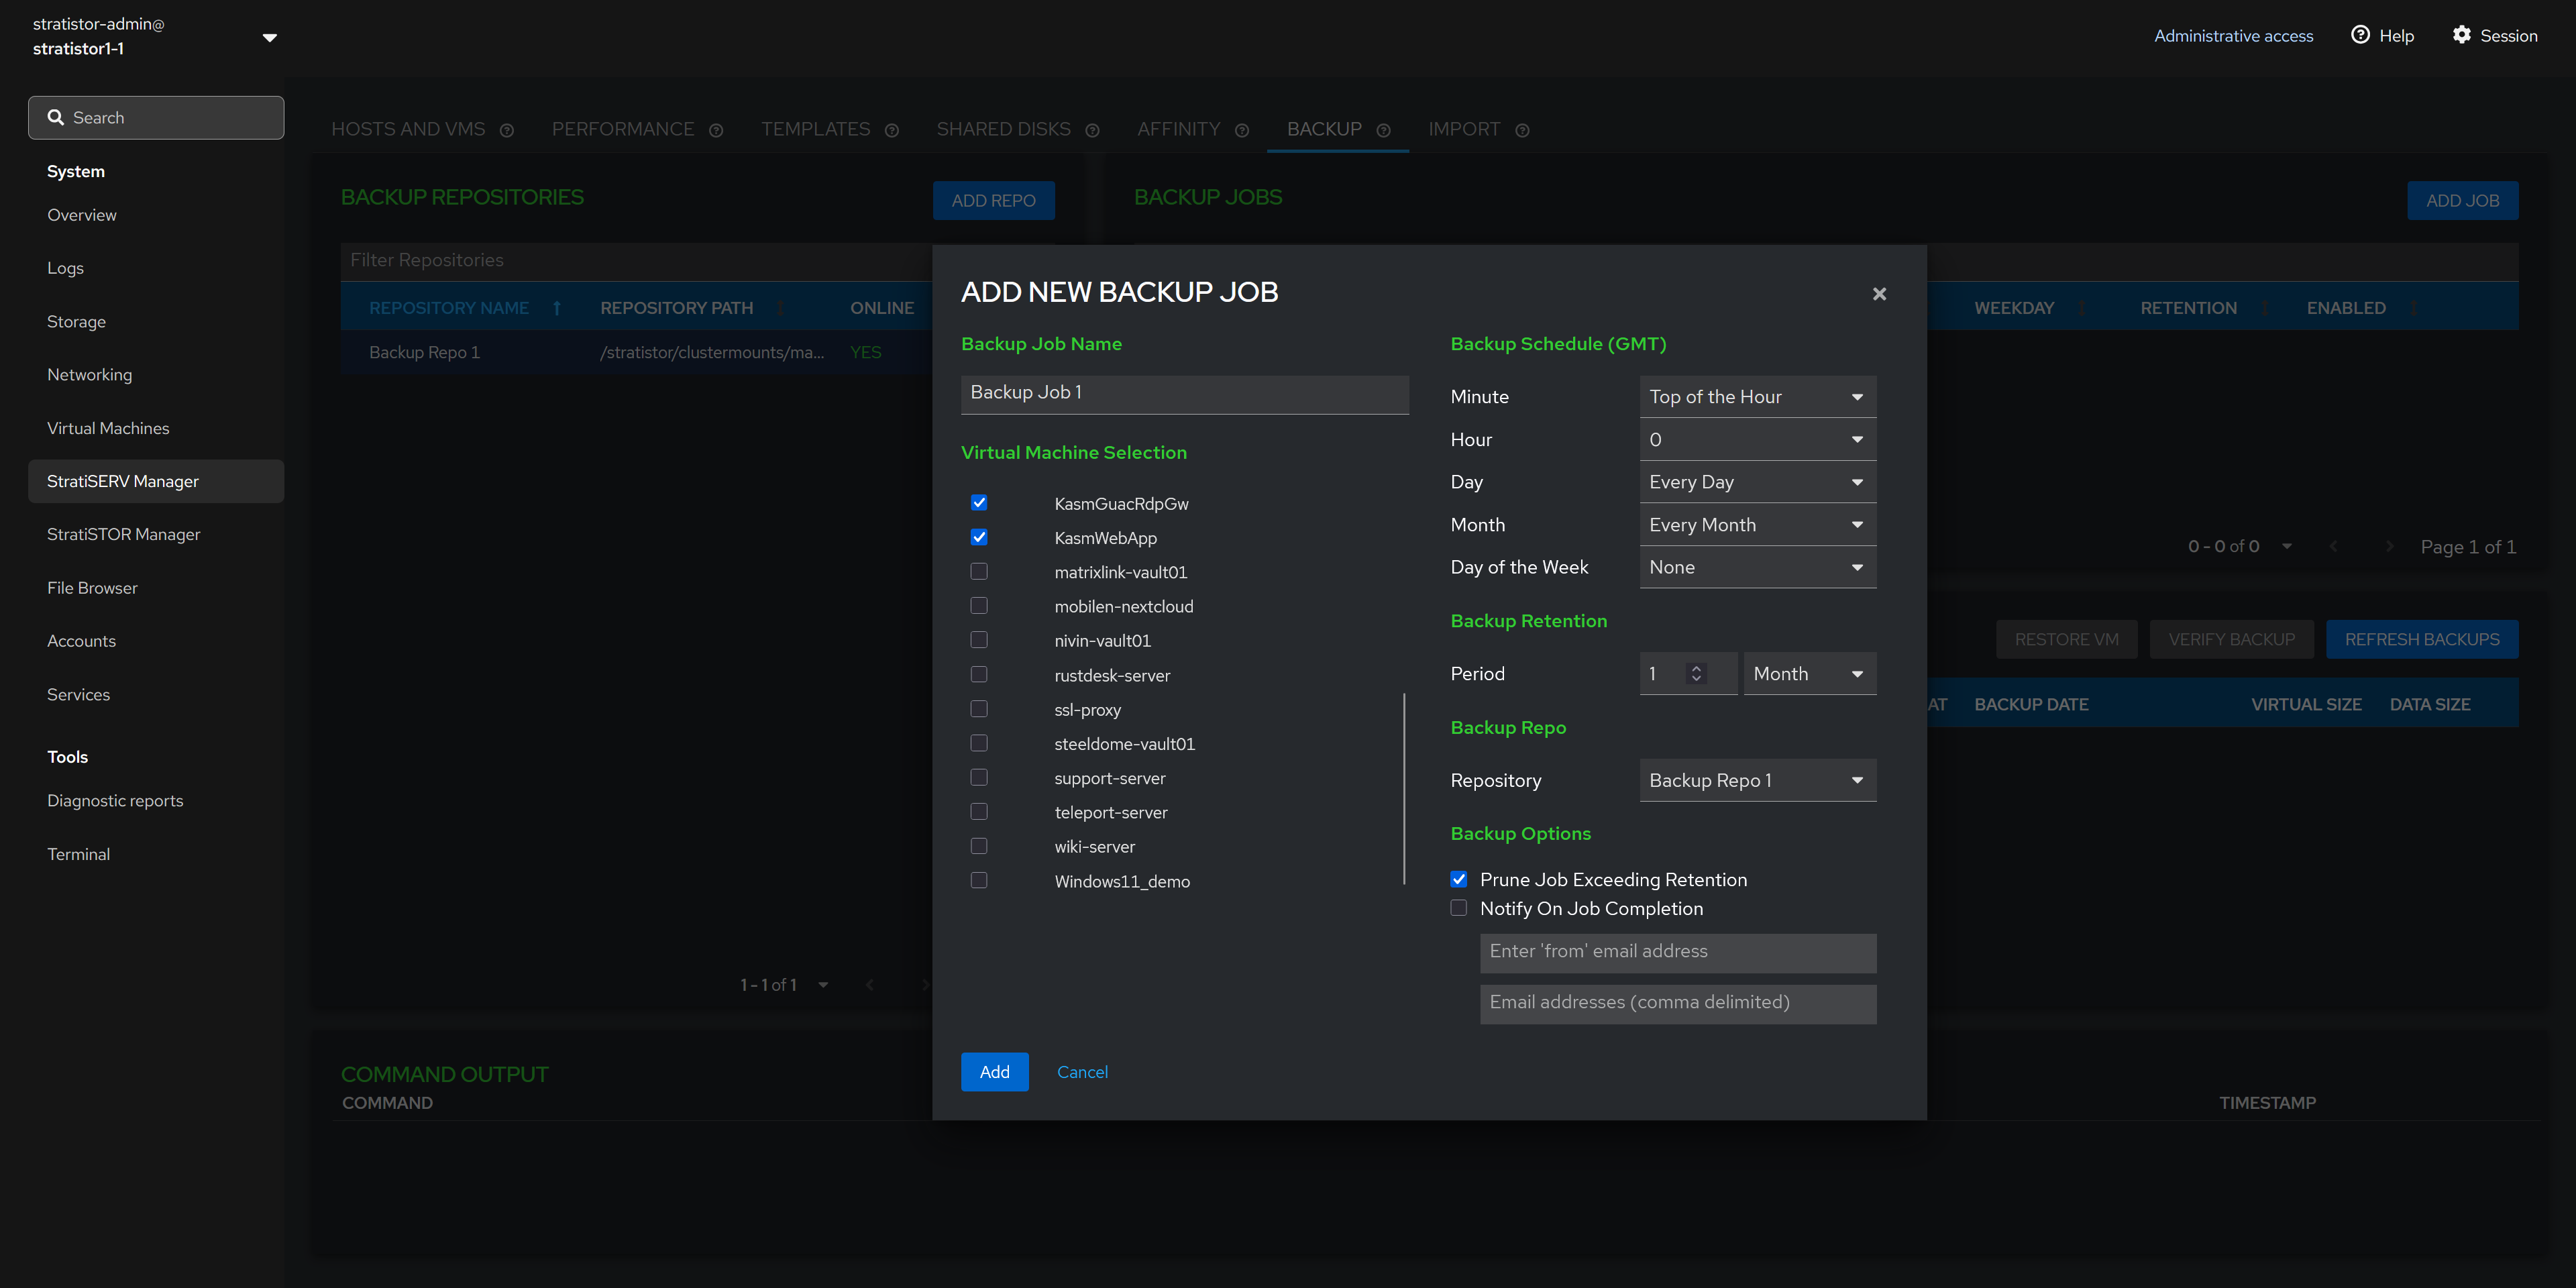
The backup job view consists of a unique name for the job, at least one VM to backup, the backup schedule, the backup retention period, the backup repo to use for this job, and backup options such as purging and notification settings.
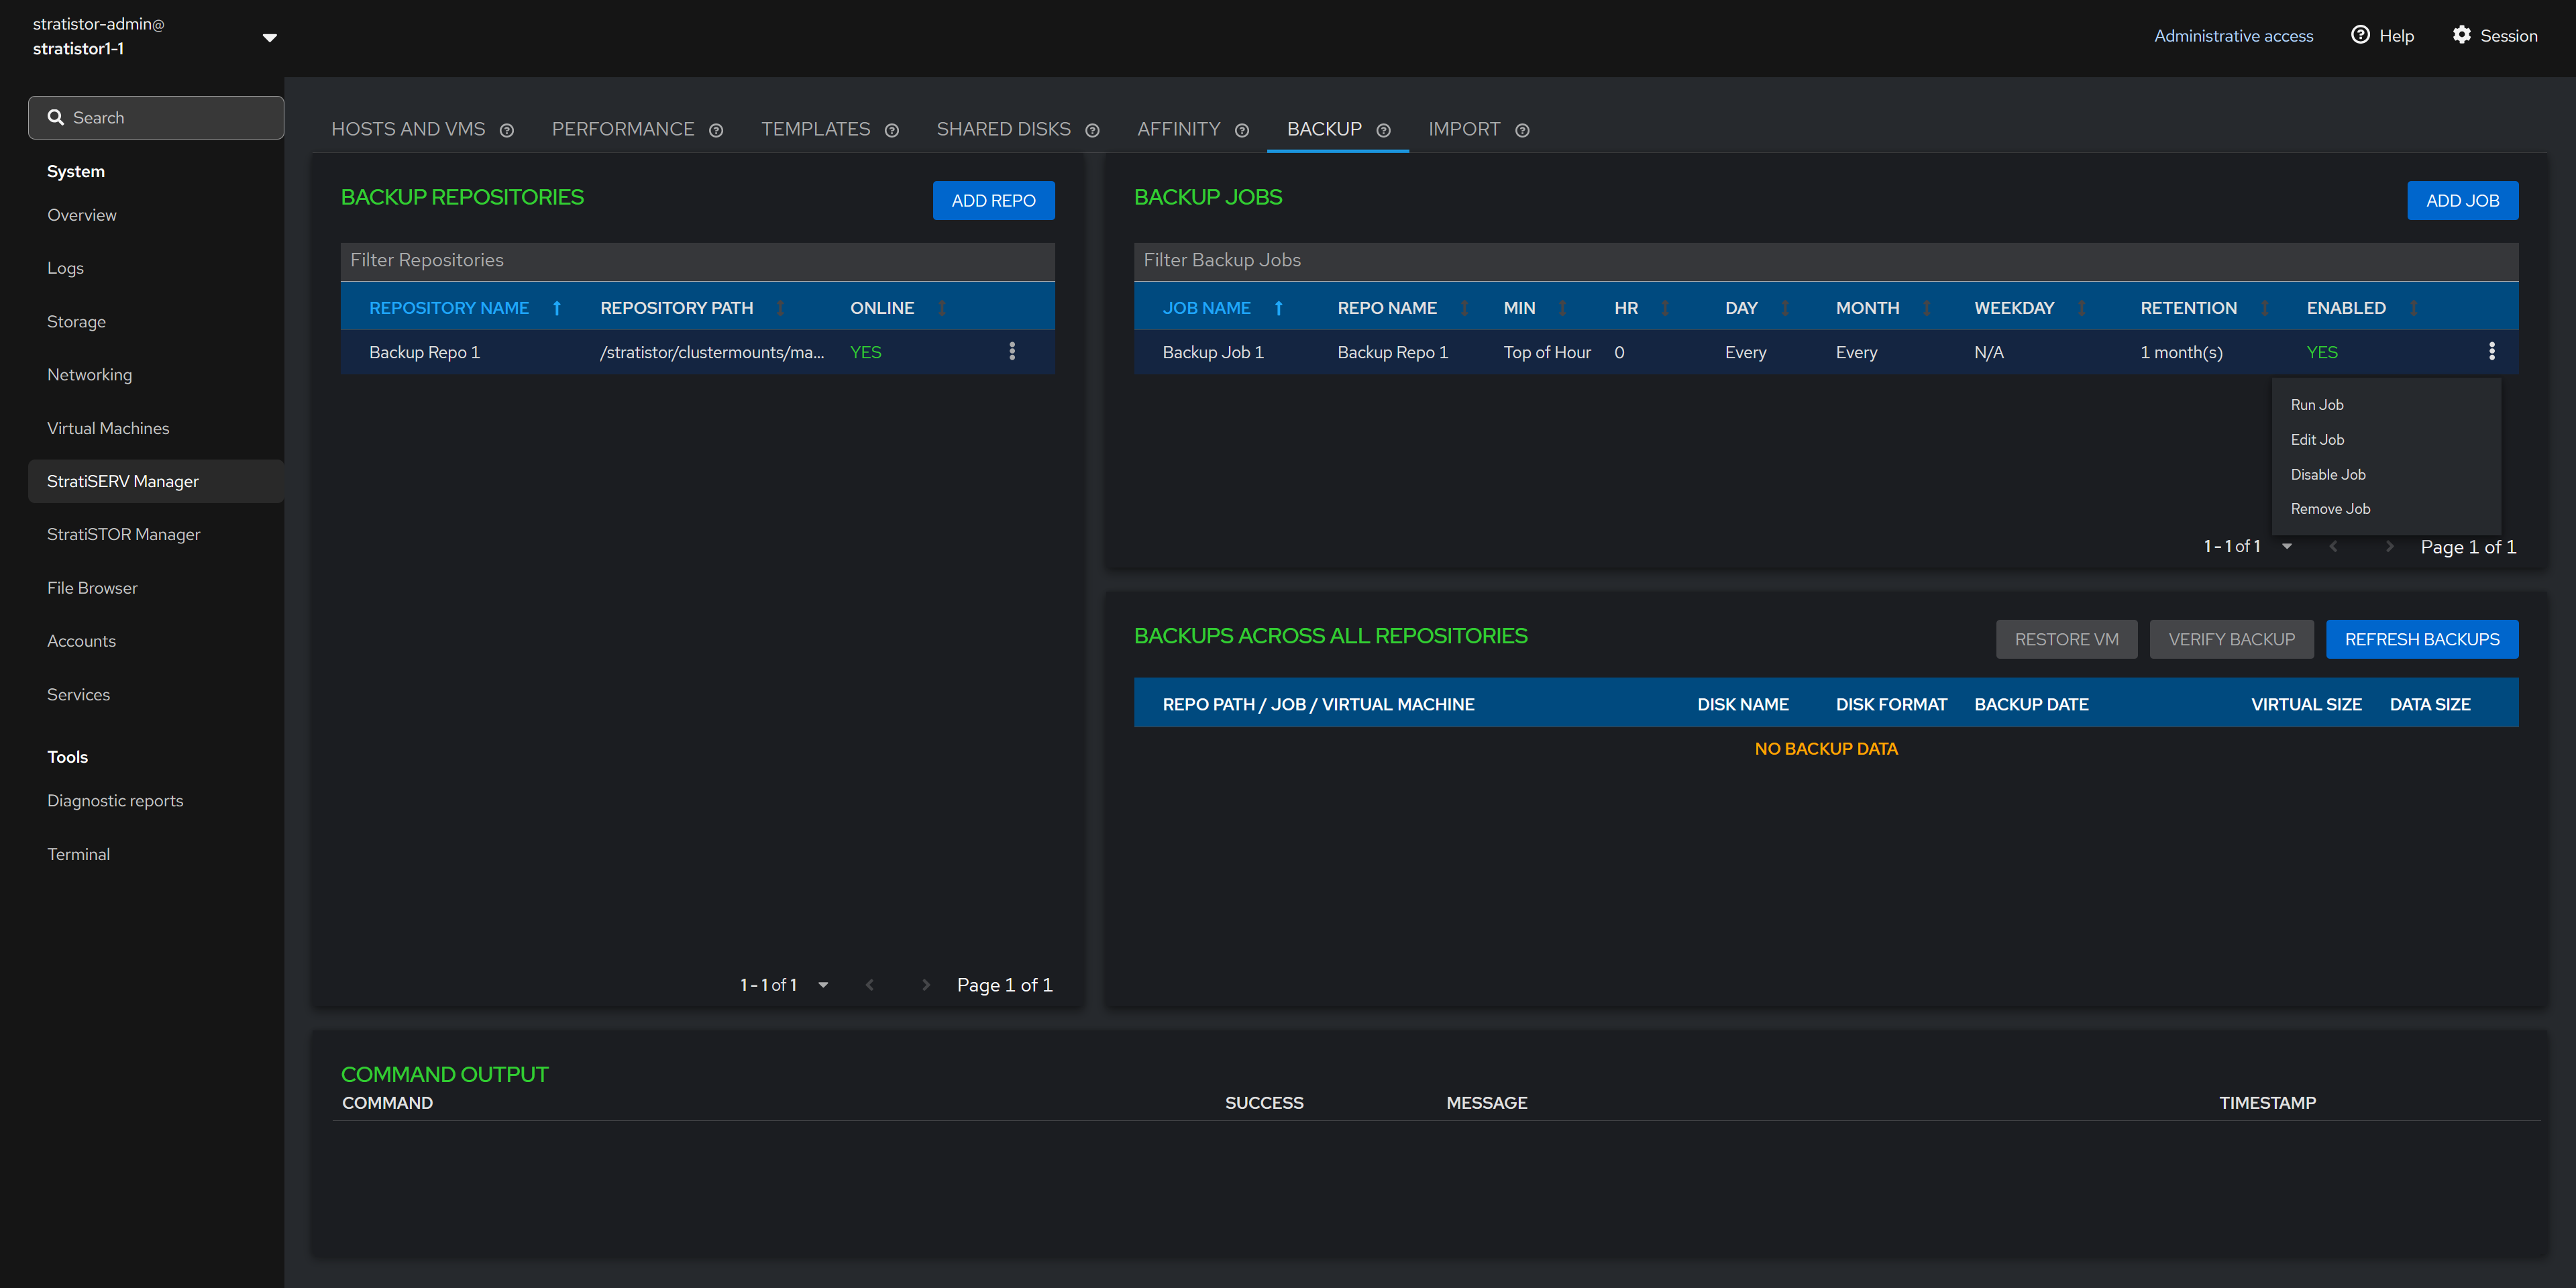
¶ BACKUP - BACKUP JOB
Once at least one backup job exists, the job will appear in the backup jobs table. Each job has an action item which allows the administrator to run the job immediately, edit the job, disable the job scheduler, and remove the job.
¶ BACKUP - BACKUP JOBS
The bottom pane in the Backup view is a tree view outlining the details about each protected VM along with details about each disk in the VM.
The Refresh Backups button polls the system for any new updates which may have occurred since the last time the view loaded.

¶ BACKUP - RESTORE A VM
Selecting a VM disk in the tree view will allow the administrator to perform two additional functions. The first is the Restore VM option. Selecting this option will present the administrator with a location selector for the restored VM files.

The second option is to verify the backup integrity for a specific disk.
¶ VM IMPORT
The Import tab allows the administrator to import VMs from other third-party platforms such as VMware and Microsoft Hyper-V directly into StratiSERV.
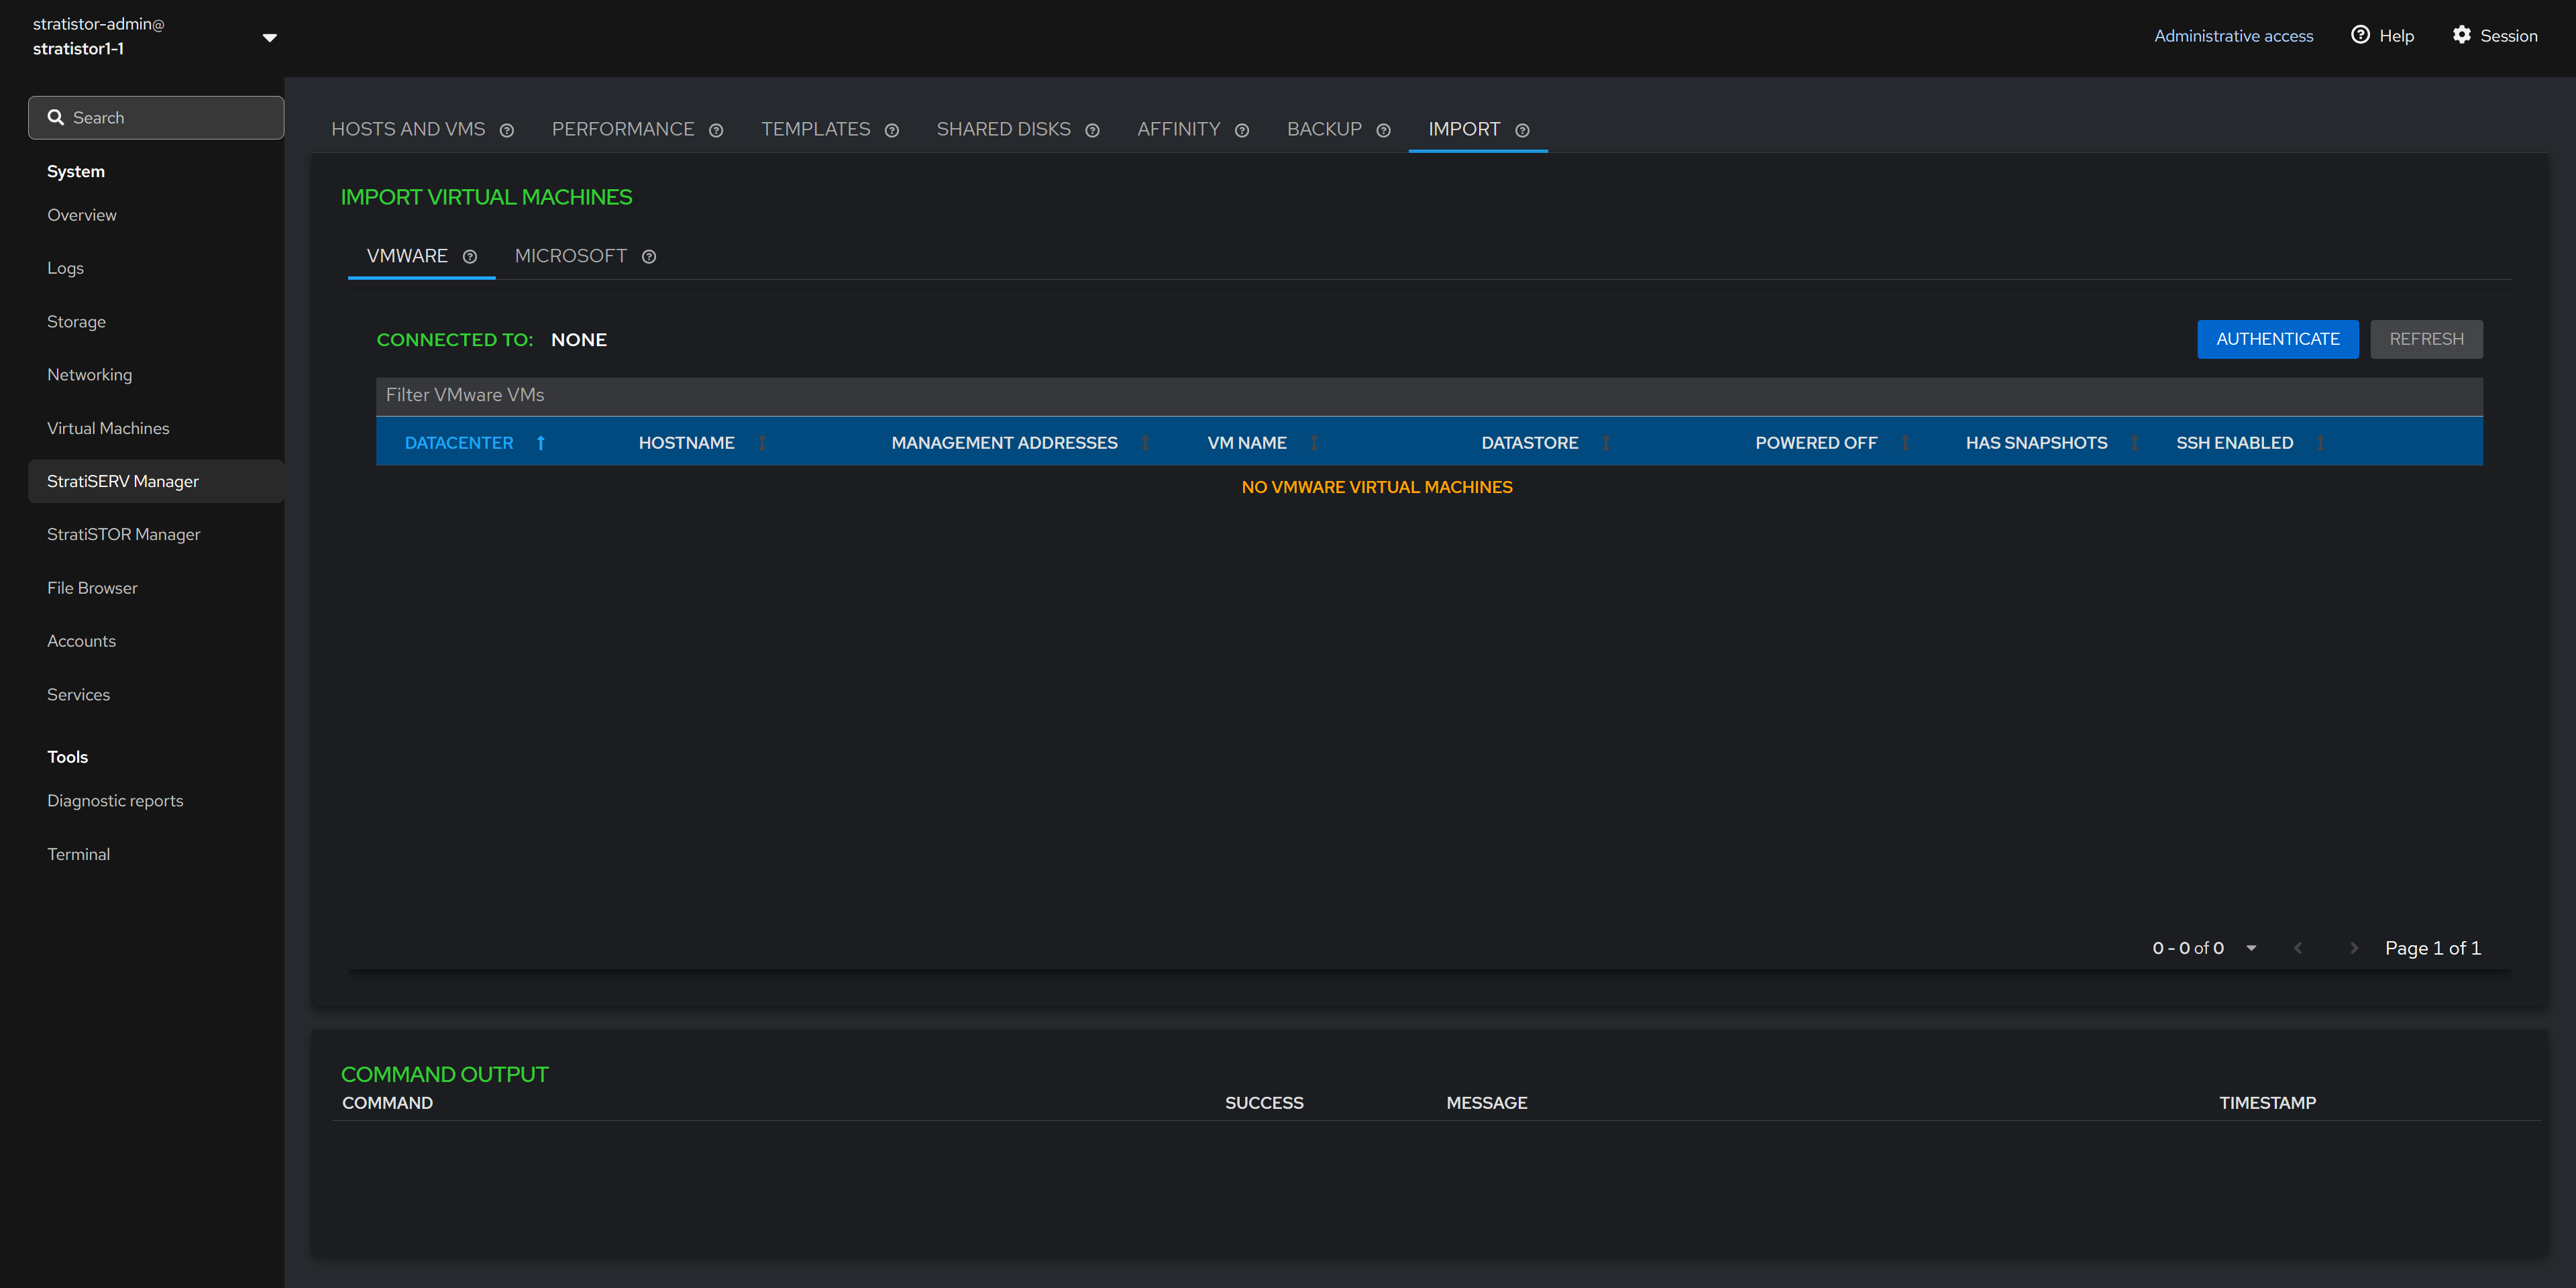
¶ VM IMPORT - VMWARE
To perform the import process with a VMware platform, click on the Authenticate button. You must provide the credentials that will be used to connect to either the VMware ESXi host or vCenter Server.

¶ VM IMPORT - VMWARE
Once authenticated, the list of all known VMs will appear in the table below. The VMs must be powered off, have no snapshots in place, and the ESX host must have SSH enabled. The import option will not be available until all three conditions are met.

Once the conditions are met the Import VM option will appear in the action button (┆) for the given VM.
¶ VM IMPORT - VMWARE
To import a VM, click on the action button (┆) for the specific VM you want to import and select Import VM.

¶ VM IMPORT - VMWARE
The final step is to provide the ESX host root credentials. You can test the credentials by clicking on the TEST CONNECTION button. Select the location for the imported VM and click the IMPORT button when ready to proceed.

¶ STRATISTOR CLUSTER MANAGER (MAIN DASHBOARD)
The StratiSTOR Management plugin provides access to all necessary storage clustering support operations.
The main Cluster Status view shows the current state of the local node and all cluster-wide services, storage manifest, and any health related notifications in real-time.

¶ LICENSING MANAGER
The license manager can be located by clicking on the info icon on the Cluster Raw Capacity line in the status table.

NOTE: If you have deployed HyperSERV (StratiSTOR and StratiSERV), the license manager is only available on this tab. This license manager handles both products.
¶ BLOCK SERVICES
The Block Services tab provides access to all block storage pools and devices created from the pools. To add a new block device pool, click on the ADD POOL button.
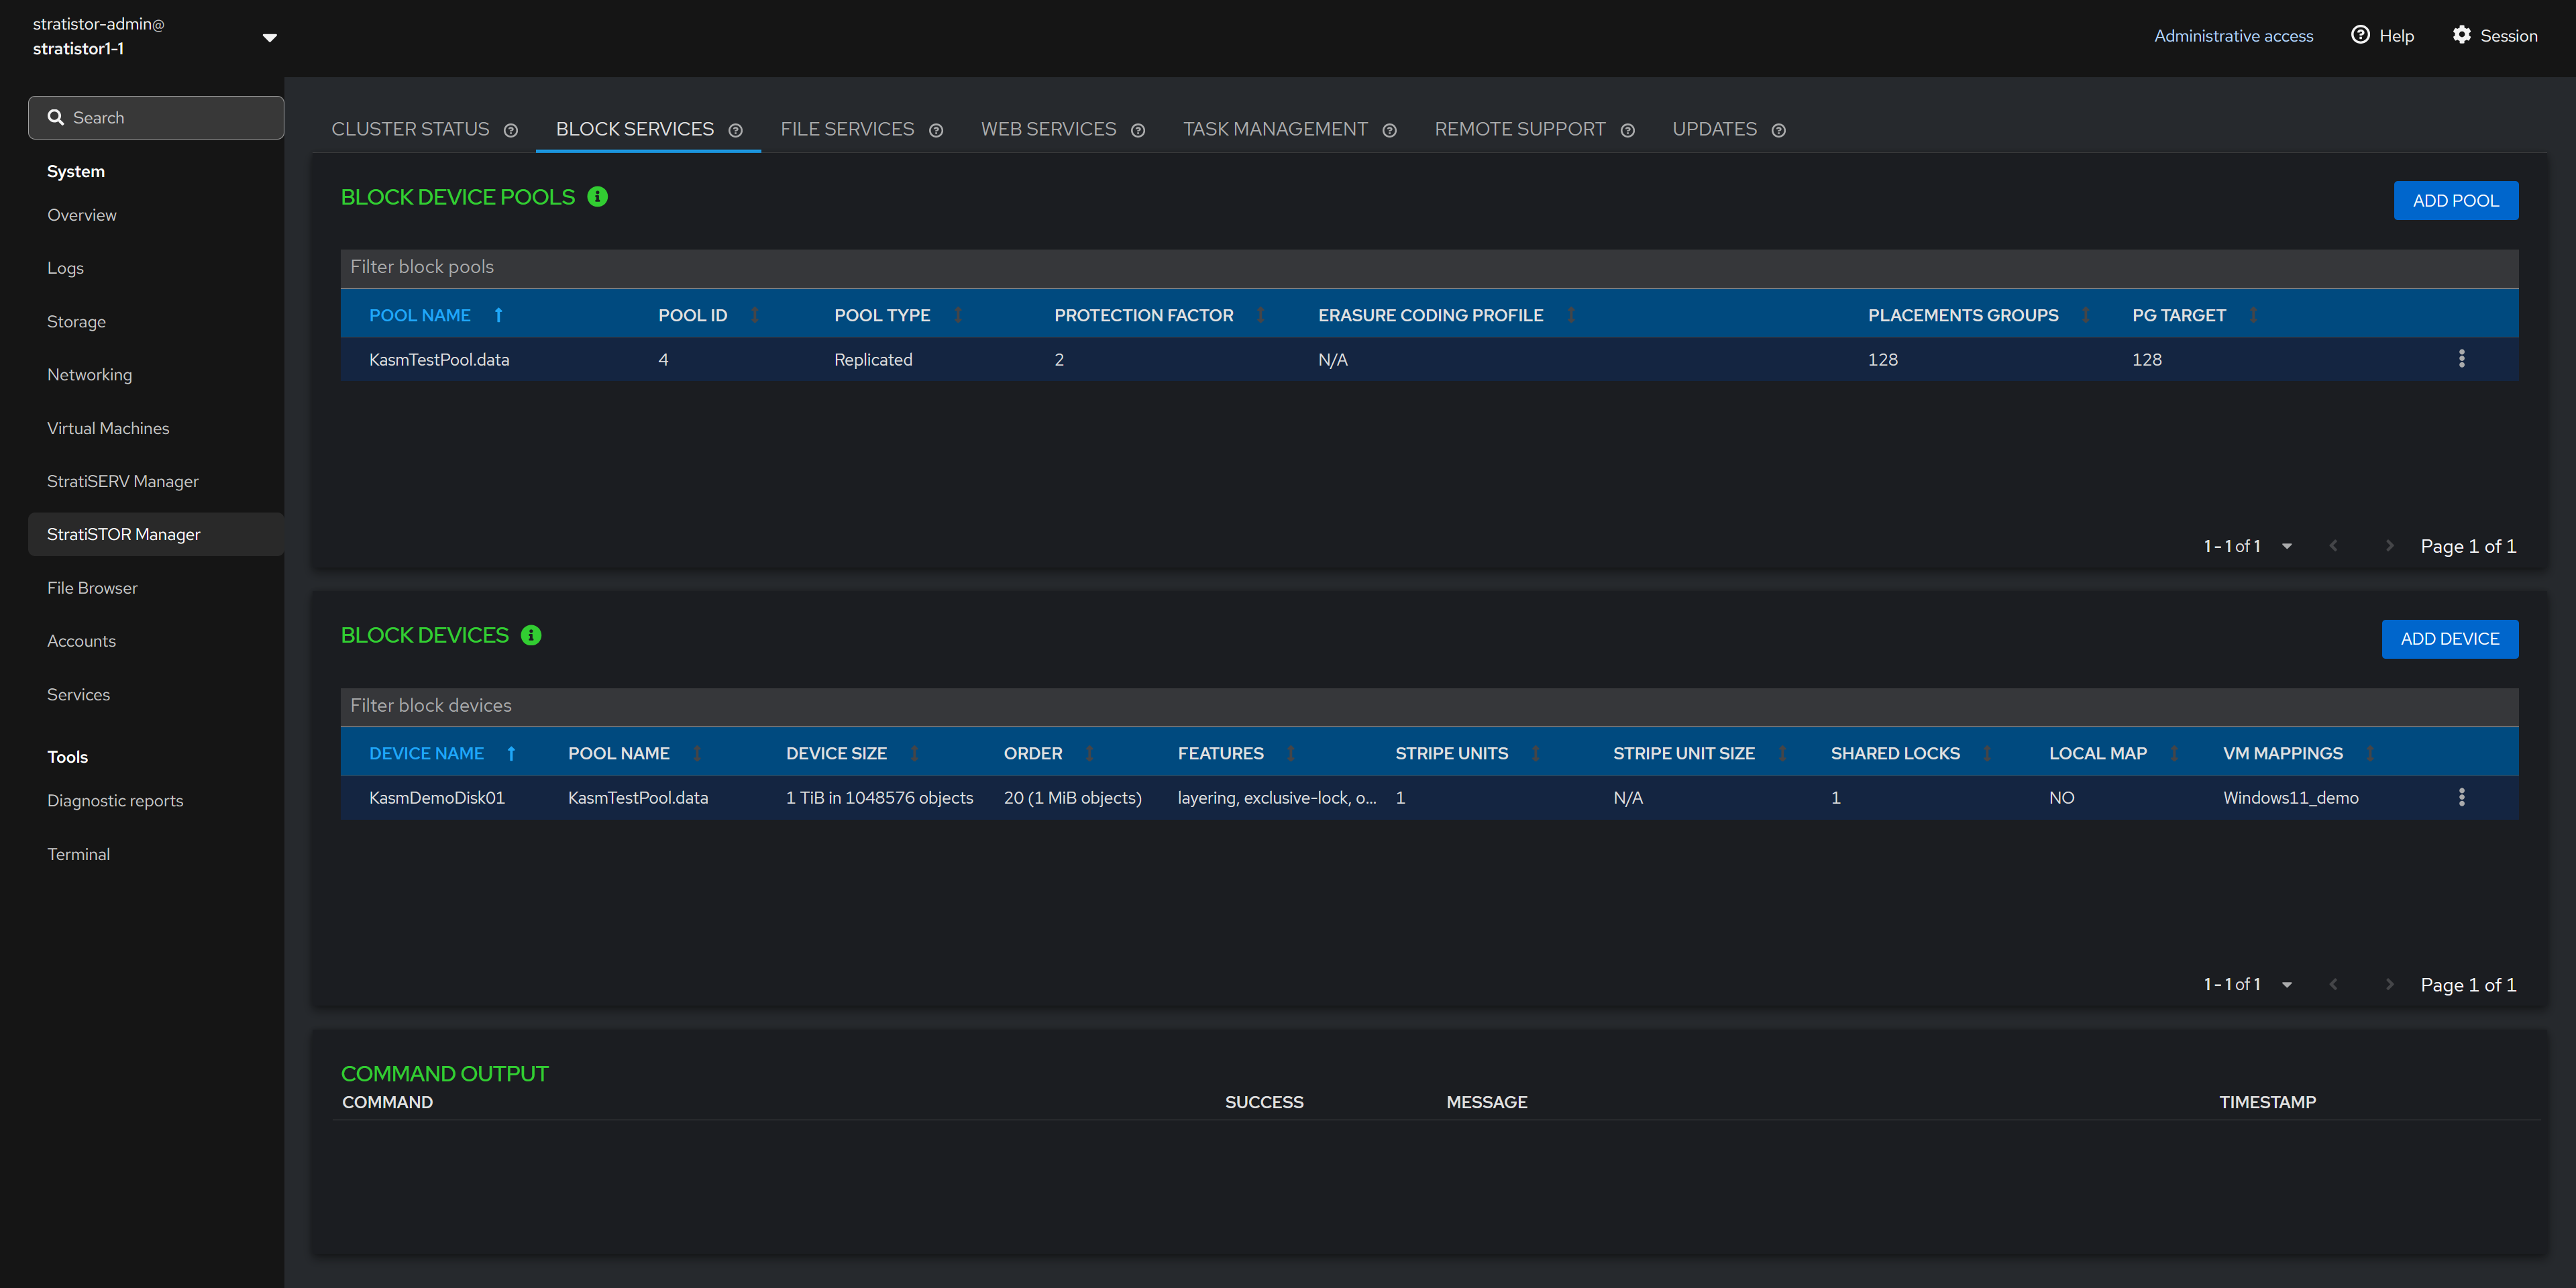
NOTE: Block pools can be renamed and deleted.
NOTE: Block devices can be renamed, deleted, mapped to a virtual machine (if VM services are enabled), and mapped to the local cluster node.
¶ BLOCK SERVICES - ADD BLOCK POOL
The Add Block Pool view allows the administrator to define the pool name, Data Pool Placement Group (PG) count, Metadata Pool Placement Group (PG) count (if using erasure-coding), protection scheme (either replicated or erasure-coded), and the replication factor (if using replicated protection scheme).
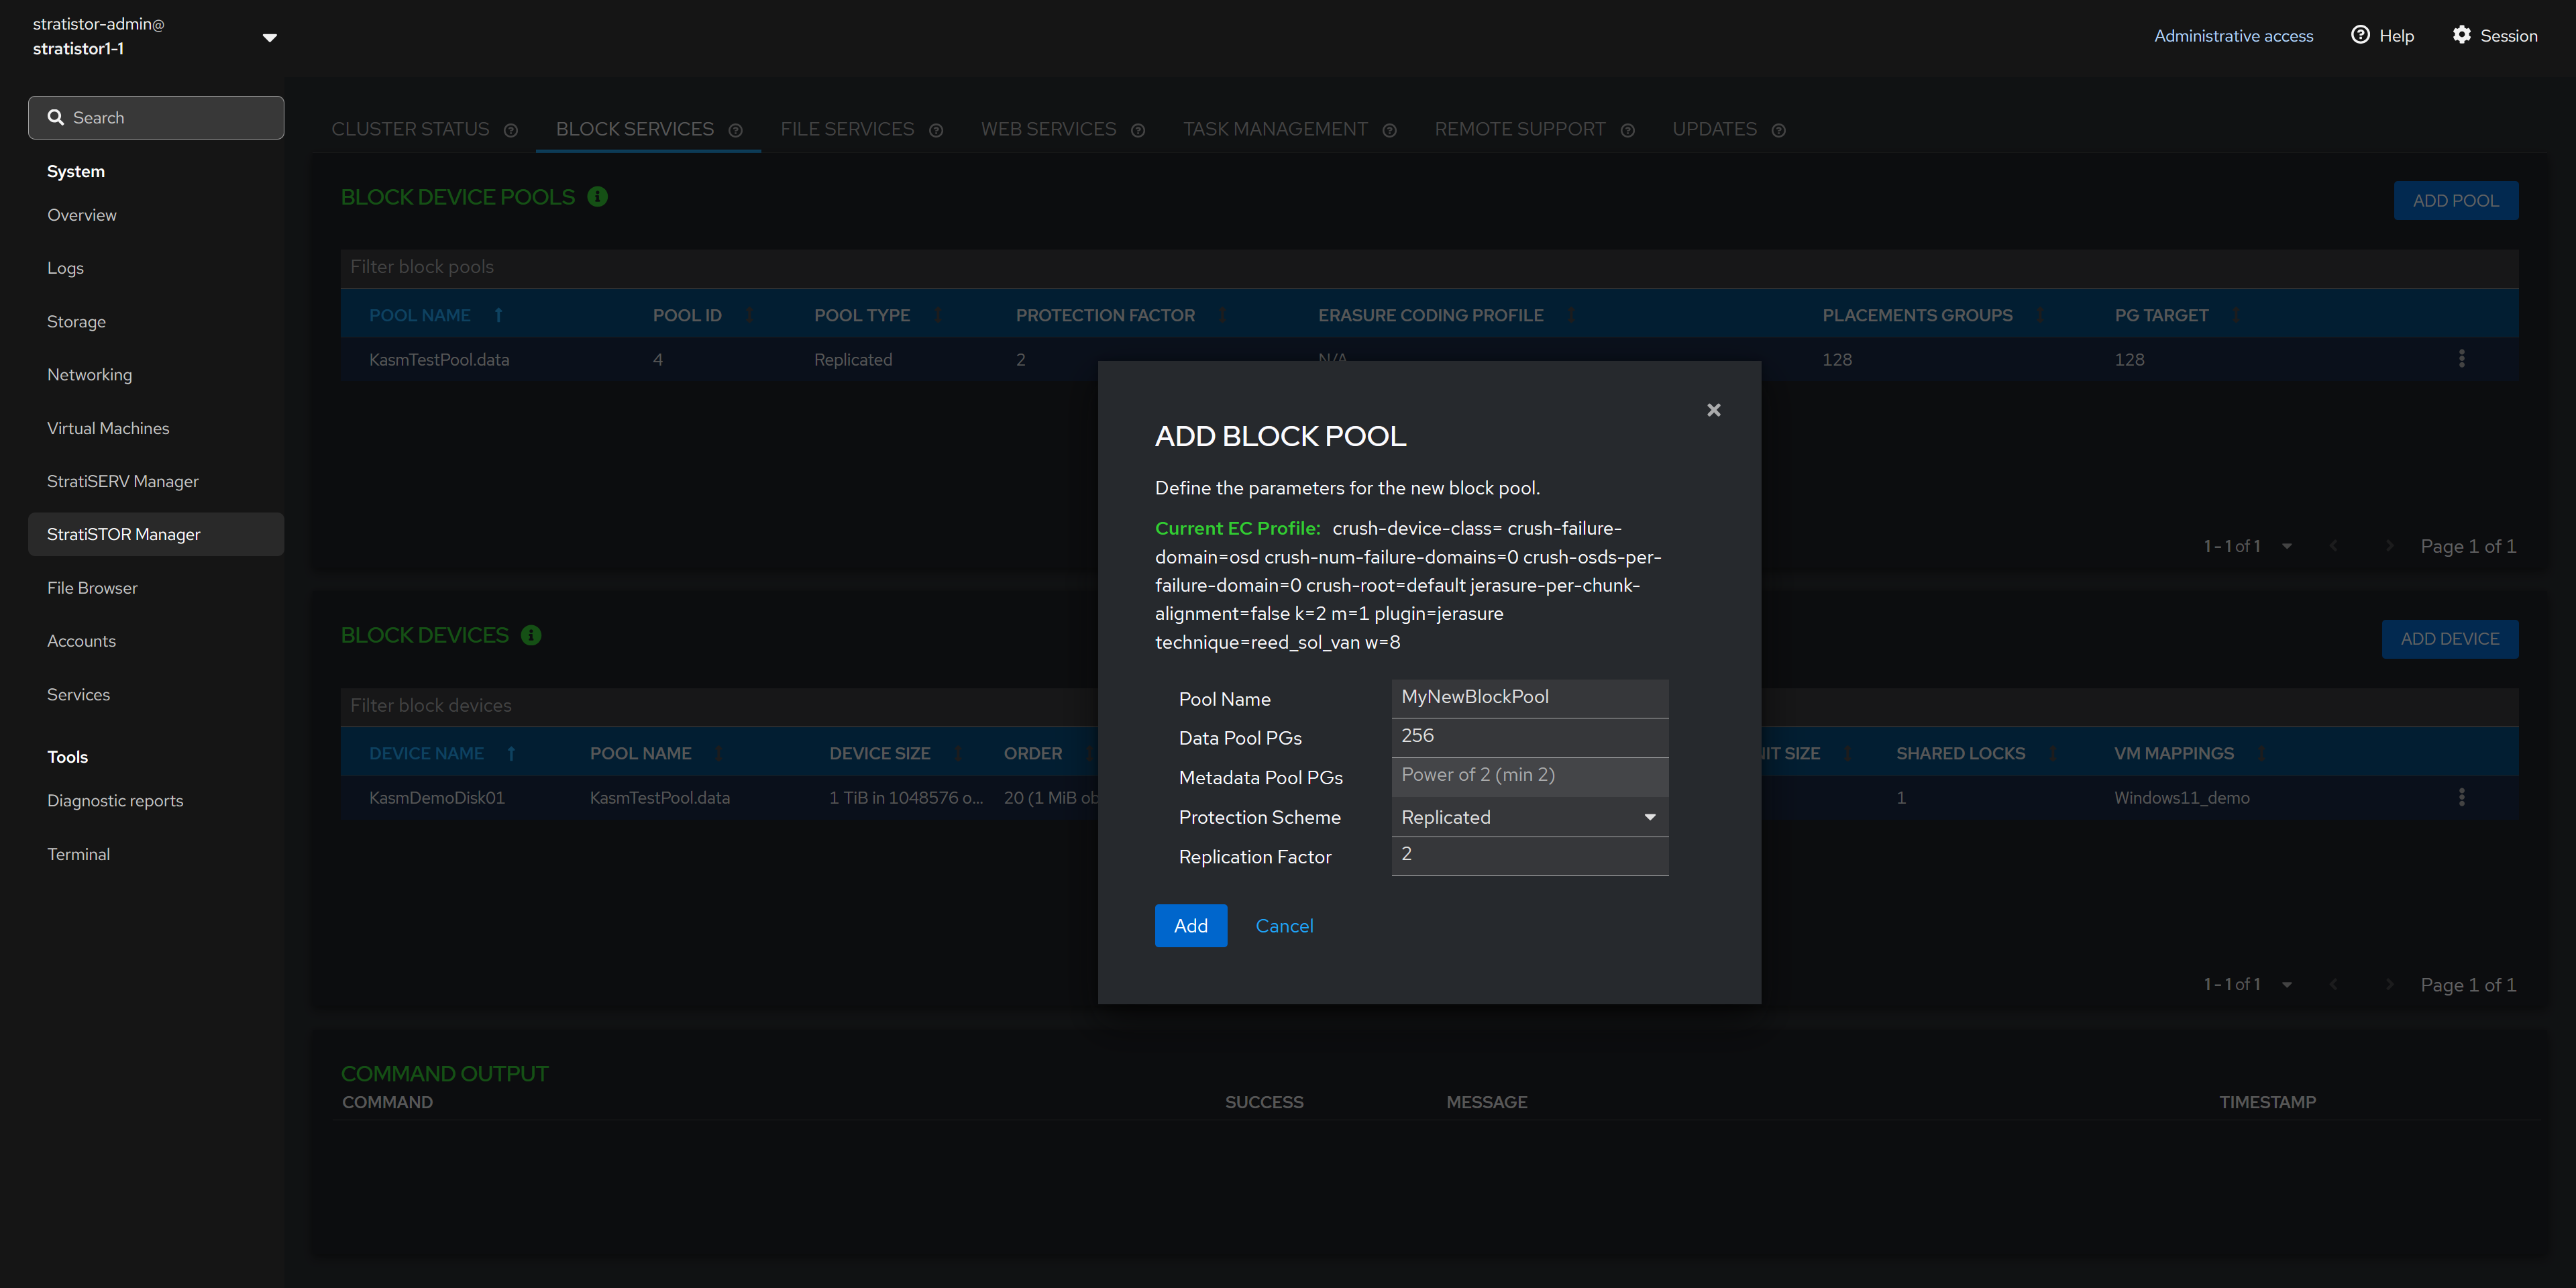
NOTE: If using erasure-coding for the data pool, the metadata pool must be a replicated pool and will be created as such automatically.
NOTE: If using erasure-coding for the protection scheme, the cluster is set with a default EC profile as shown in the view. If this needs to be changed to a different scheme definition, you must perform this at the command line or within the advanced storage administration web interface (see the advanced configuration guide for more details).
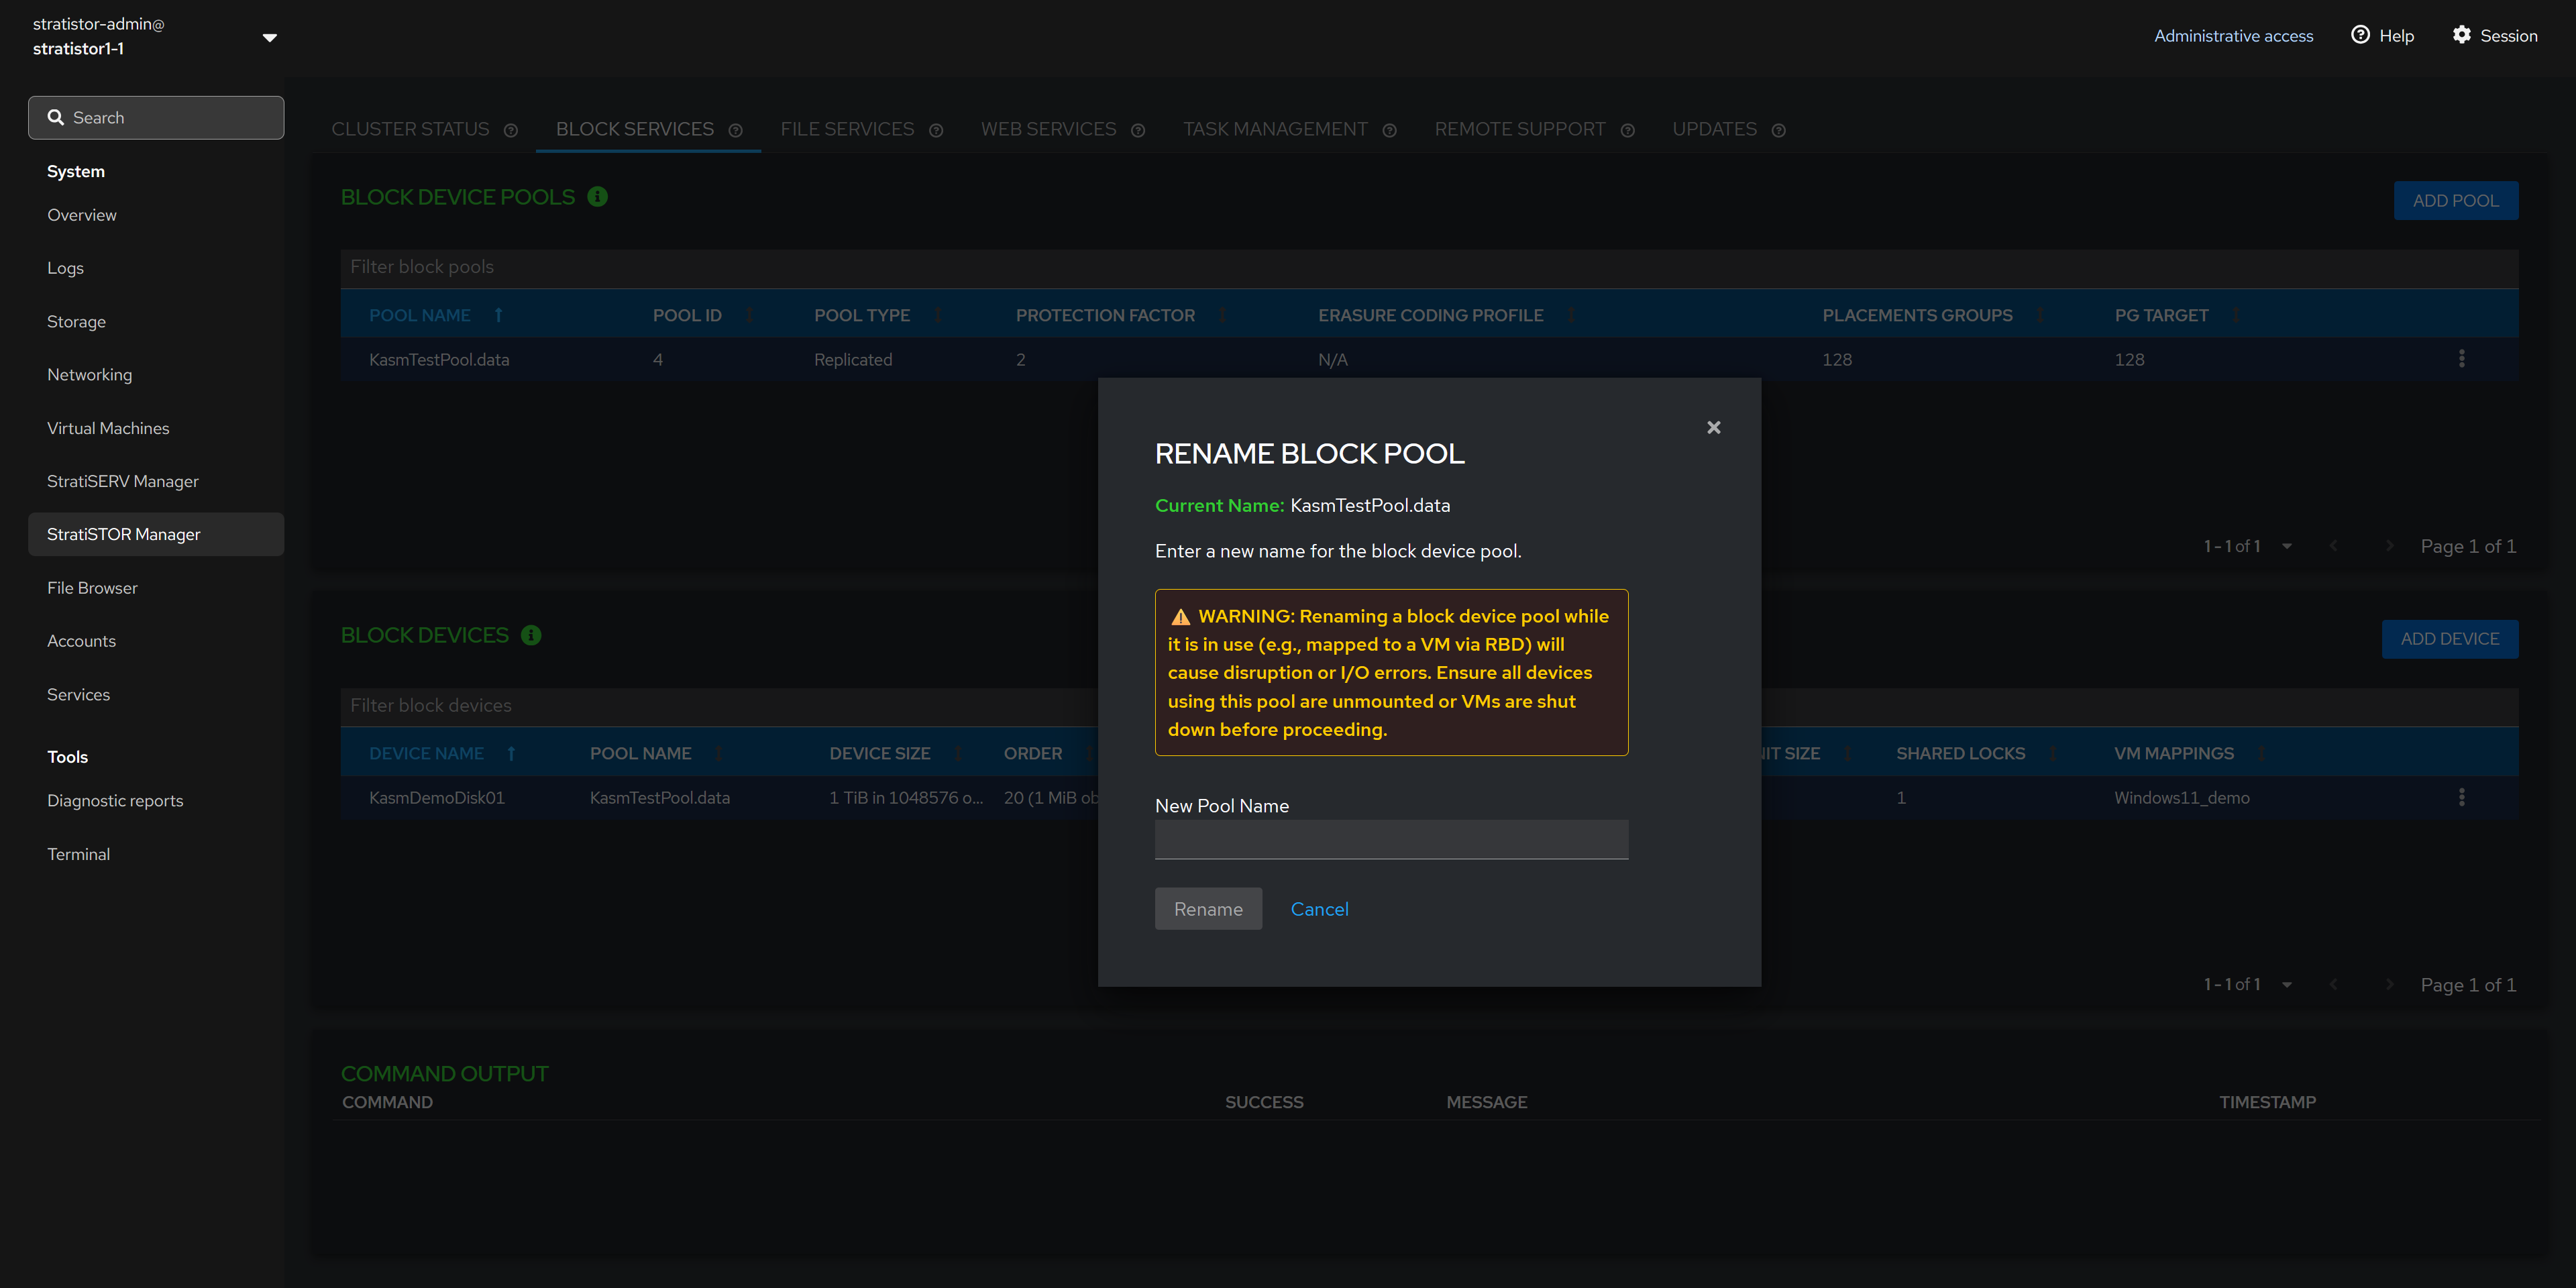
¶ BLOCK SERVICES - RENAME BLOCK POOL
The Rename Block Pool view allows the administrator to change the block pool name. Enter the new pool name and click RENAME when ready to proceed.
¶ BLOCK SERVICES - ADD BLOCK DEVICE
The Add New Block Device view allows the administrator to create a new block device from an existing block device pool.
To create a new block device, provide the block device name, capacity in GB or TBs, the primary pool to use, the secondary data pool if data and metadata separation are required (otherwise leave empty), object size, stripe unit size, and stripe count.
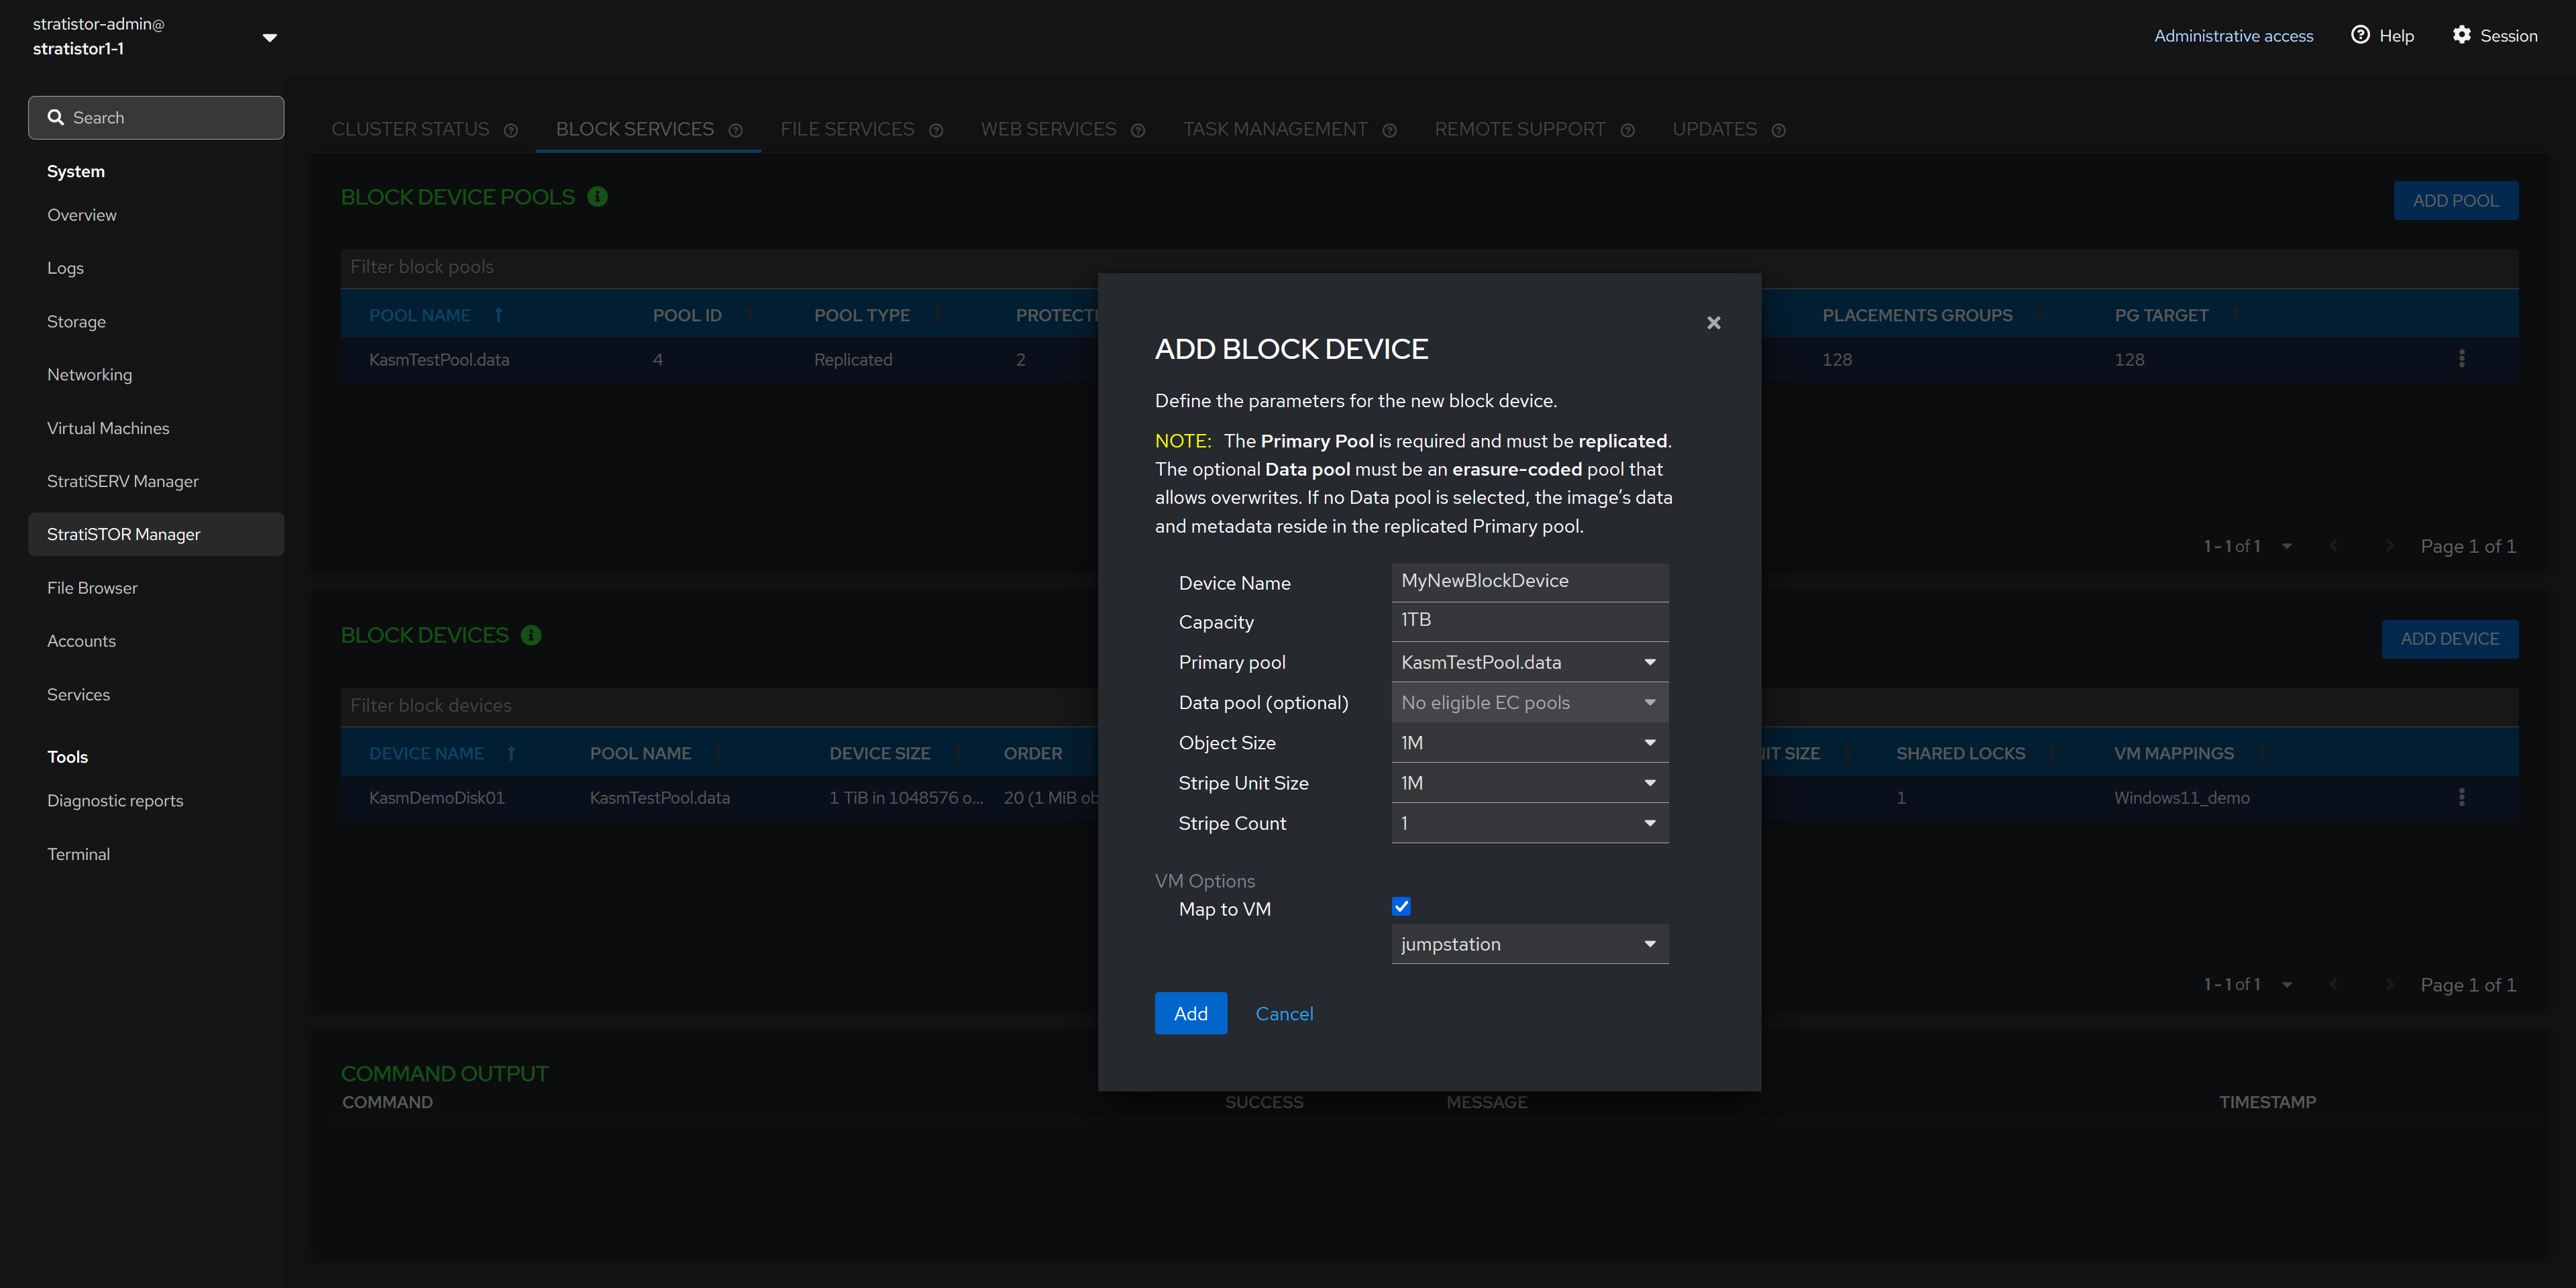
NOTE: If unsure about the object size, stripe unit size, and stripe count values, accept the defaults as these are optimal for most scenarios.
¶ FILE SERVICES
The File Services tab provides access to all filesystem and file sharing services. To add a new filesystem, click on the ADD FILESYSTEM button.

¶ FILE SERVICES - ADD NEW FILESYSTEM
To add a new filesystem to be used for SMB or NFS, click on the ADD FILESYSTEM button. This will present the Add New Filesystem view to provide the filesystem name, number of Placement Groups for the data pool, number of Placement Groups for the metadata pool (if using erasure coding), protection scheme of replication or erasure coding, and replication factor if using replication as the protection scheme.
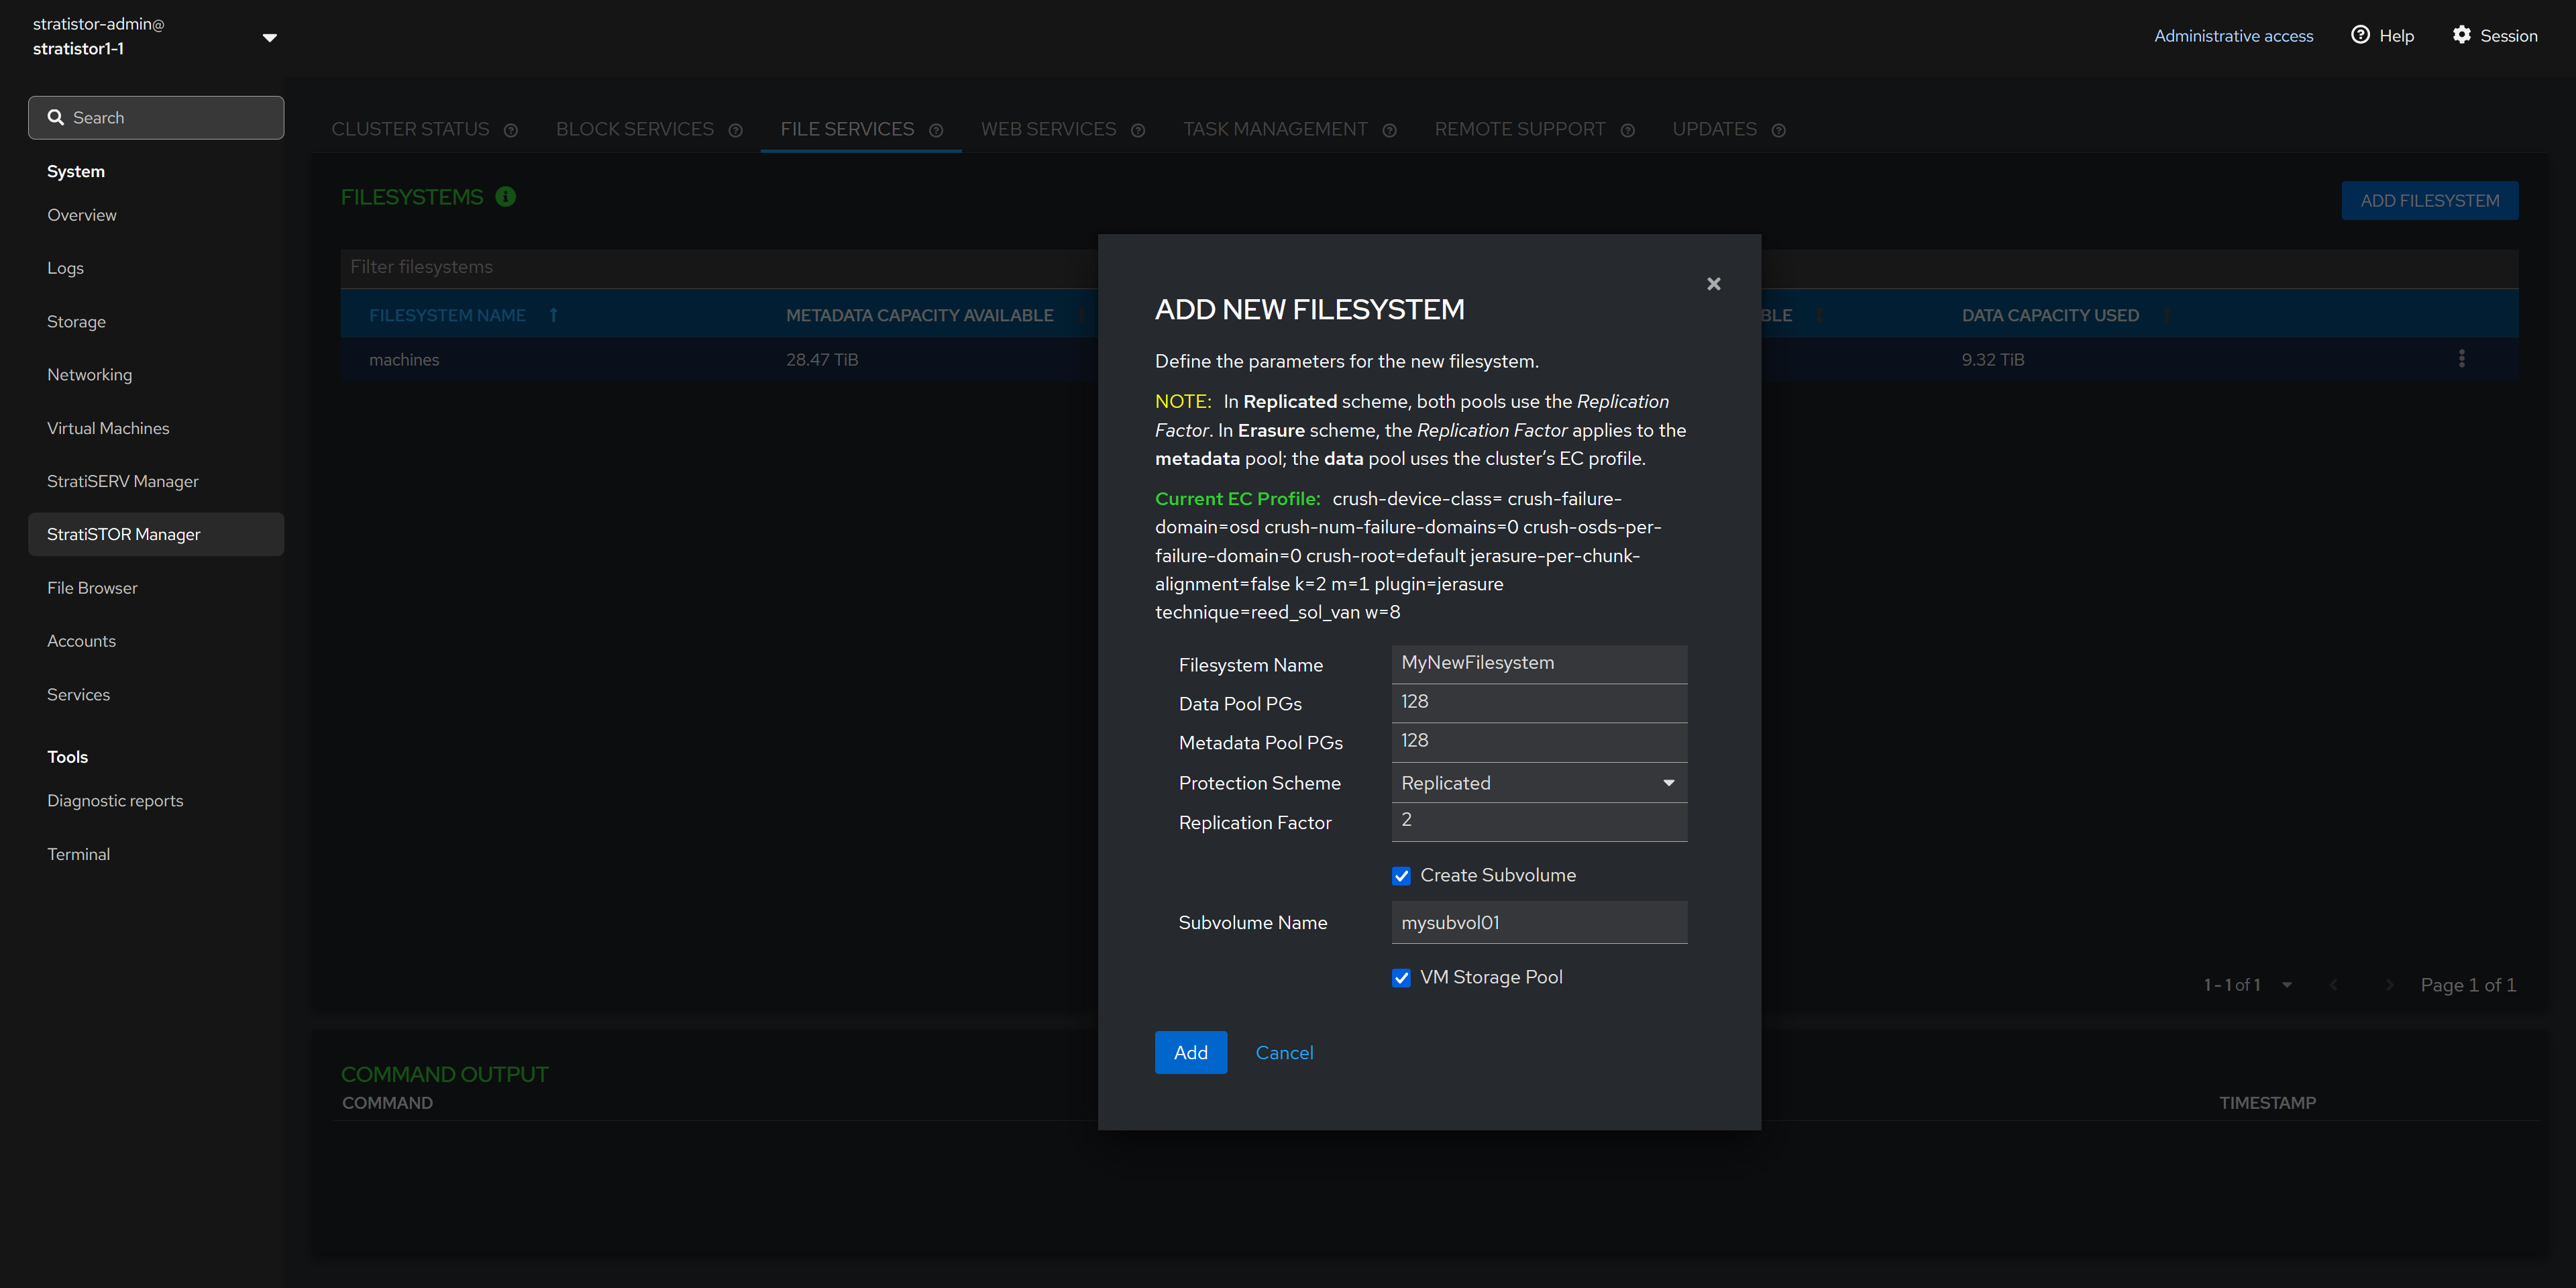
NOTE: If using erasure-coding for the protection scheme, the cluster is set with a default EC profile as shown in the view. If this needs to be changed to a different scheme definition, you must perform this at the command line or within the advanced storage administration web interface (see the advanced configuration guide for more details).
¶ FILE SERVICES - DELETE FILESYSTEM
To delete a filesystem, click in the action button (┆) for the specific filesystem and click Delete. The Delete Filesystem confirmation view will appear. This requires the operator to type CONFIRM (in all caps). When ready to proceed, click on the Confirm button.
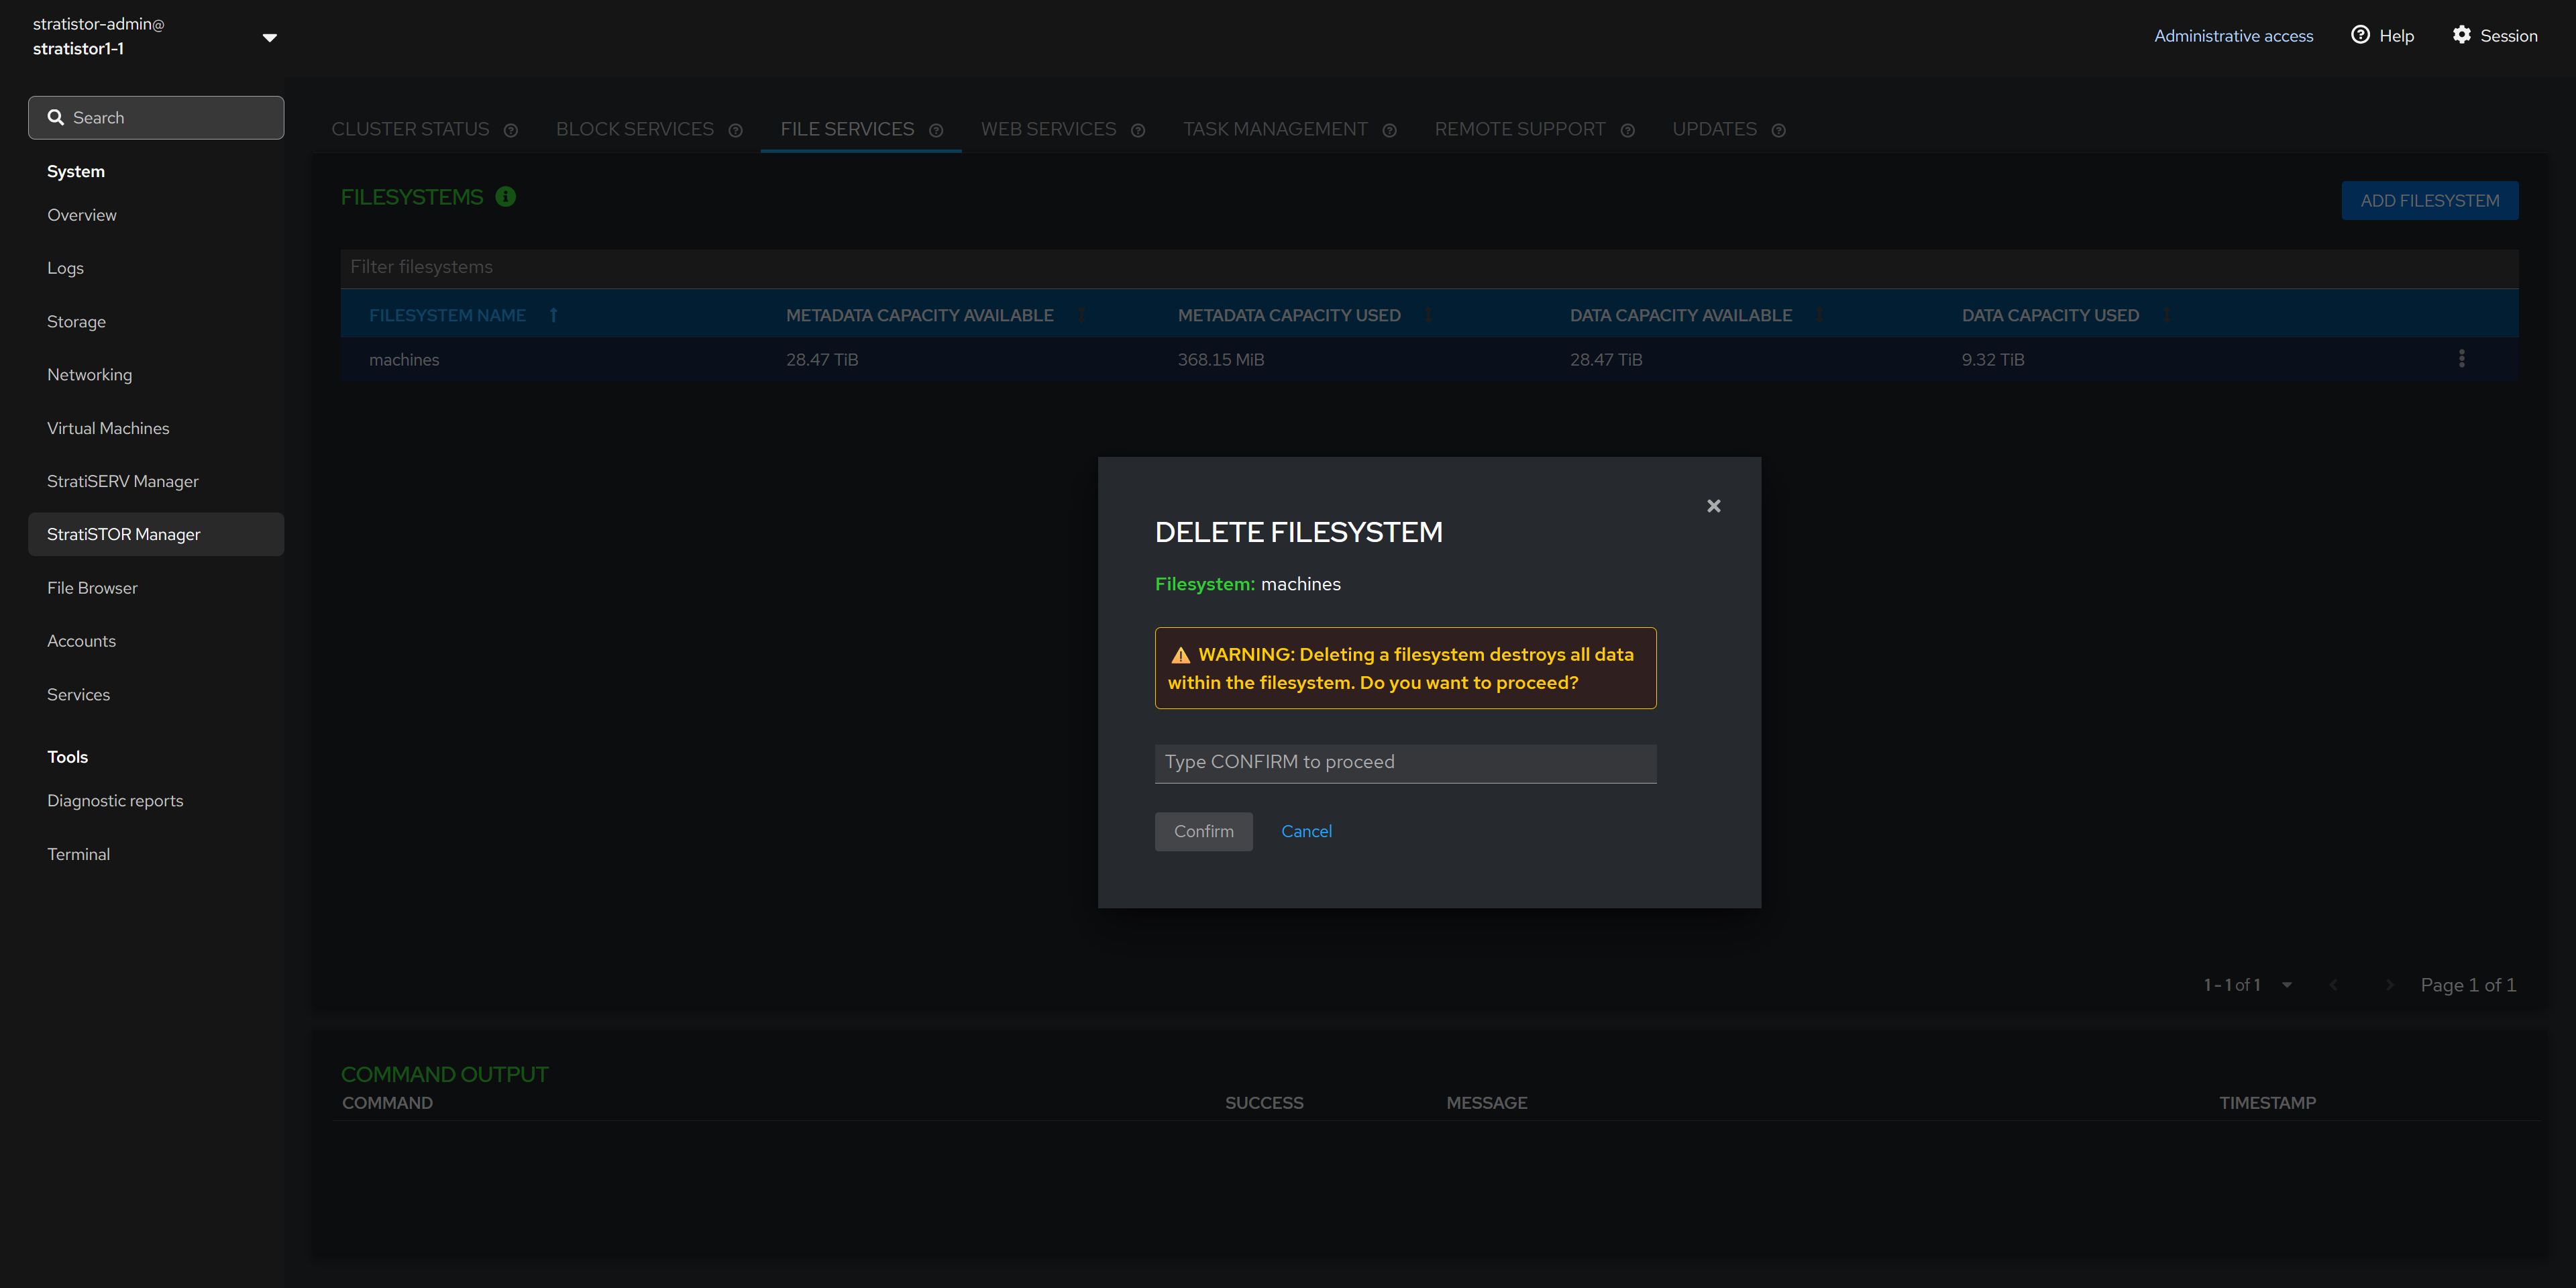
NOTE: Ensure that all IO has stopped to the filesystem and that the filesystem has been globally unmounted before deleting the filesystem.
¶ FILE SERVICES - ADD SMB GROUP
If the SMB protocol is enabled on the cluster, you will see the SMB tab in the lower portion of the File Services pane.
To create a new SMB user group, click on the ADD GROUP button. The Add SMB Group view will appear. Provide a unique name for the new SMB group and click the ADD button when ready to proceed.

NOTE: SMB services can also utilize Active Directory integration for account access and management. The local cluster accounts and AD accounts can be simultaneously assigned to a share for access. AD integration can be done from the provisioning engine (see the advanced systems guide for more information).
¶ FILE SERVICES - ADD SMB USER
To create a new SMB user, click on the ADD USER button. The Add SMB User view will appear. Provide a unique user name for the new SMB user, password, and assigned SMB user groups. Click the ADD button when ready to proceed.

¶ FILE SERVICES - ADD SMB SHARE
To create a new SMB share, click on the ADD SHARE button. The Add SMB Share view will appear. Provide an SMB share name, the filesystem which will be the basis for the file share, a subdirectory within the filesystem to map to, and the SMB groups which should be provided access to the share. When ready to proceed, click on the ADD button.

NOTE: The default subdirectory is ‘/’, which is the root of the filesystem. If you designate a different subdirectory, the system will check to see if the subdirectory exists. If the directory doesn’t exist, the system will create it.
¶ WEB SERVICES
The web services engine provides an alternative way to access any filesystem via a secure high-performance web browser. This is provided on a per cluster-node basis which allows each node to present a different filesystem from the underlying cluster if necessary.
The web service pane displays the current nodes’ portal name, filesystem, binding address, binding port, and certificate information (default self-signed certificates are automatically generated).

¶ WEB SERVICES - SERVICE CONTROL
The web service engine state can be controlled by clicking on the SERVICE CONTROL button. The current state along with stop, start and restart options will be displayed in the service control view.

¶ WEB SERVICES - CONFIGURATION
The web services configuration can be modified by clicking on the EDIT CONFIG button. This will open the web engine config view which will allow the administrator to modify the portal name, binding server address, binding server port, the filesystem root path, the portal admin password, and the certificates used for SSL communication.

NOTE: The Filesystem Path will always mount to the root of the selected filesystem. The administrator can modify the scope of the filesystem that is made accessible by the web engine from the web engine configuration console.
¶ GLOBAL TASK MANAGEMENT
The global task management system is a cluster-wide service which allows administrators to automate and perform any task or group of tasks that require execution on a regular basis, such as migrating data from one location to another or perform general system administrative functions.

The tasks can be scheduled to run on one or all the nodes in the cluster as necessary. The automation tasks can be written in any language such as python, bash shell script, powershell, and many more.
¶ GLOBAL TASK MANAGEMENT - CREATE TASK
To create a task, click on the Schedule tab and then click the Add New Event button. This will open the task wizard where the administrator can define what the task is and how it is to be executed.

¶ REMOTE SUPPORT
The StratiSYSTEM platform has call-home remote support capability which allows SteelDome support personnel to connect and assist with support requests.
When enabled, the service forms a secure reverse tunnel which doesn’t require corporate firewall changes unless outbound access is blocked.
The service can be enabled when required and disabled when not.

¶ REMOTE SUPPORT - SERVICE CONTROL
The remote support service state can be controlled by clicking on the SERVICE CONTROL button. The current state along with stop, start and restart options will be displayed in the service control view.

¶ REMOTE SUPPORT - CONFIGURATION
The remote support service requires a one-time time-based support token. Once SteelDome personnel generate this token, the administrator will have five minutes to enter and activate the service or else the token will expire and become invalid.
This process only needs to be completed once. From that point forward, access can be controlled by the administrator by starting and stopping the service as required.

¶ UPDATES
The StratiSYSTEM platform can be updated directly from the web interface using the Updates tab. The current version and new version (if available) will be displayed in this pane.
Ensure that access to the internet is enabled for all nodes in the cluster, otherwise the update process will fail.

NOTE: When updates are applied they are applied to all nodes simultaneously. This process will not interrupt production services as it only interacts with the management layer of the cluster. The updates typically take two minutes to complete at which time the administrator will need to log back into the web console.
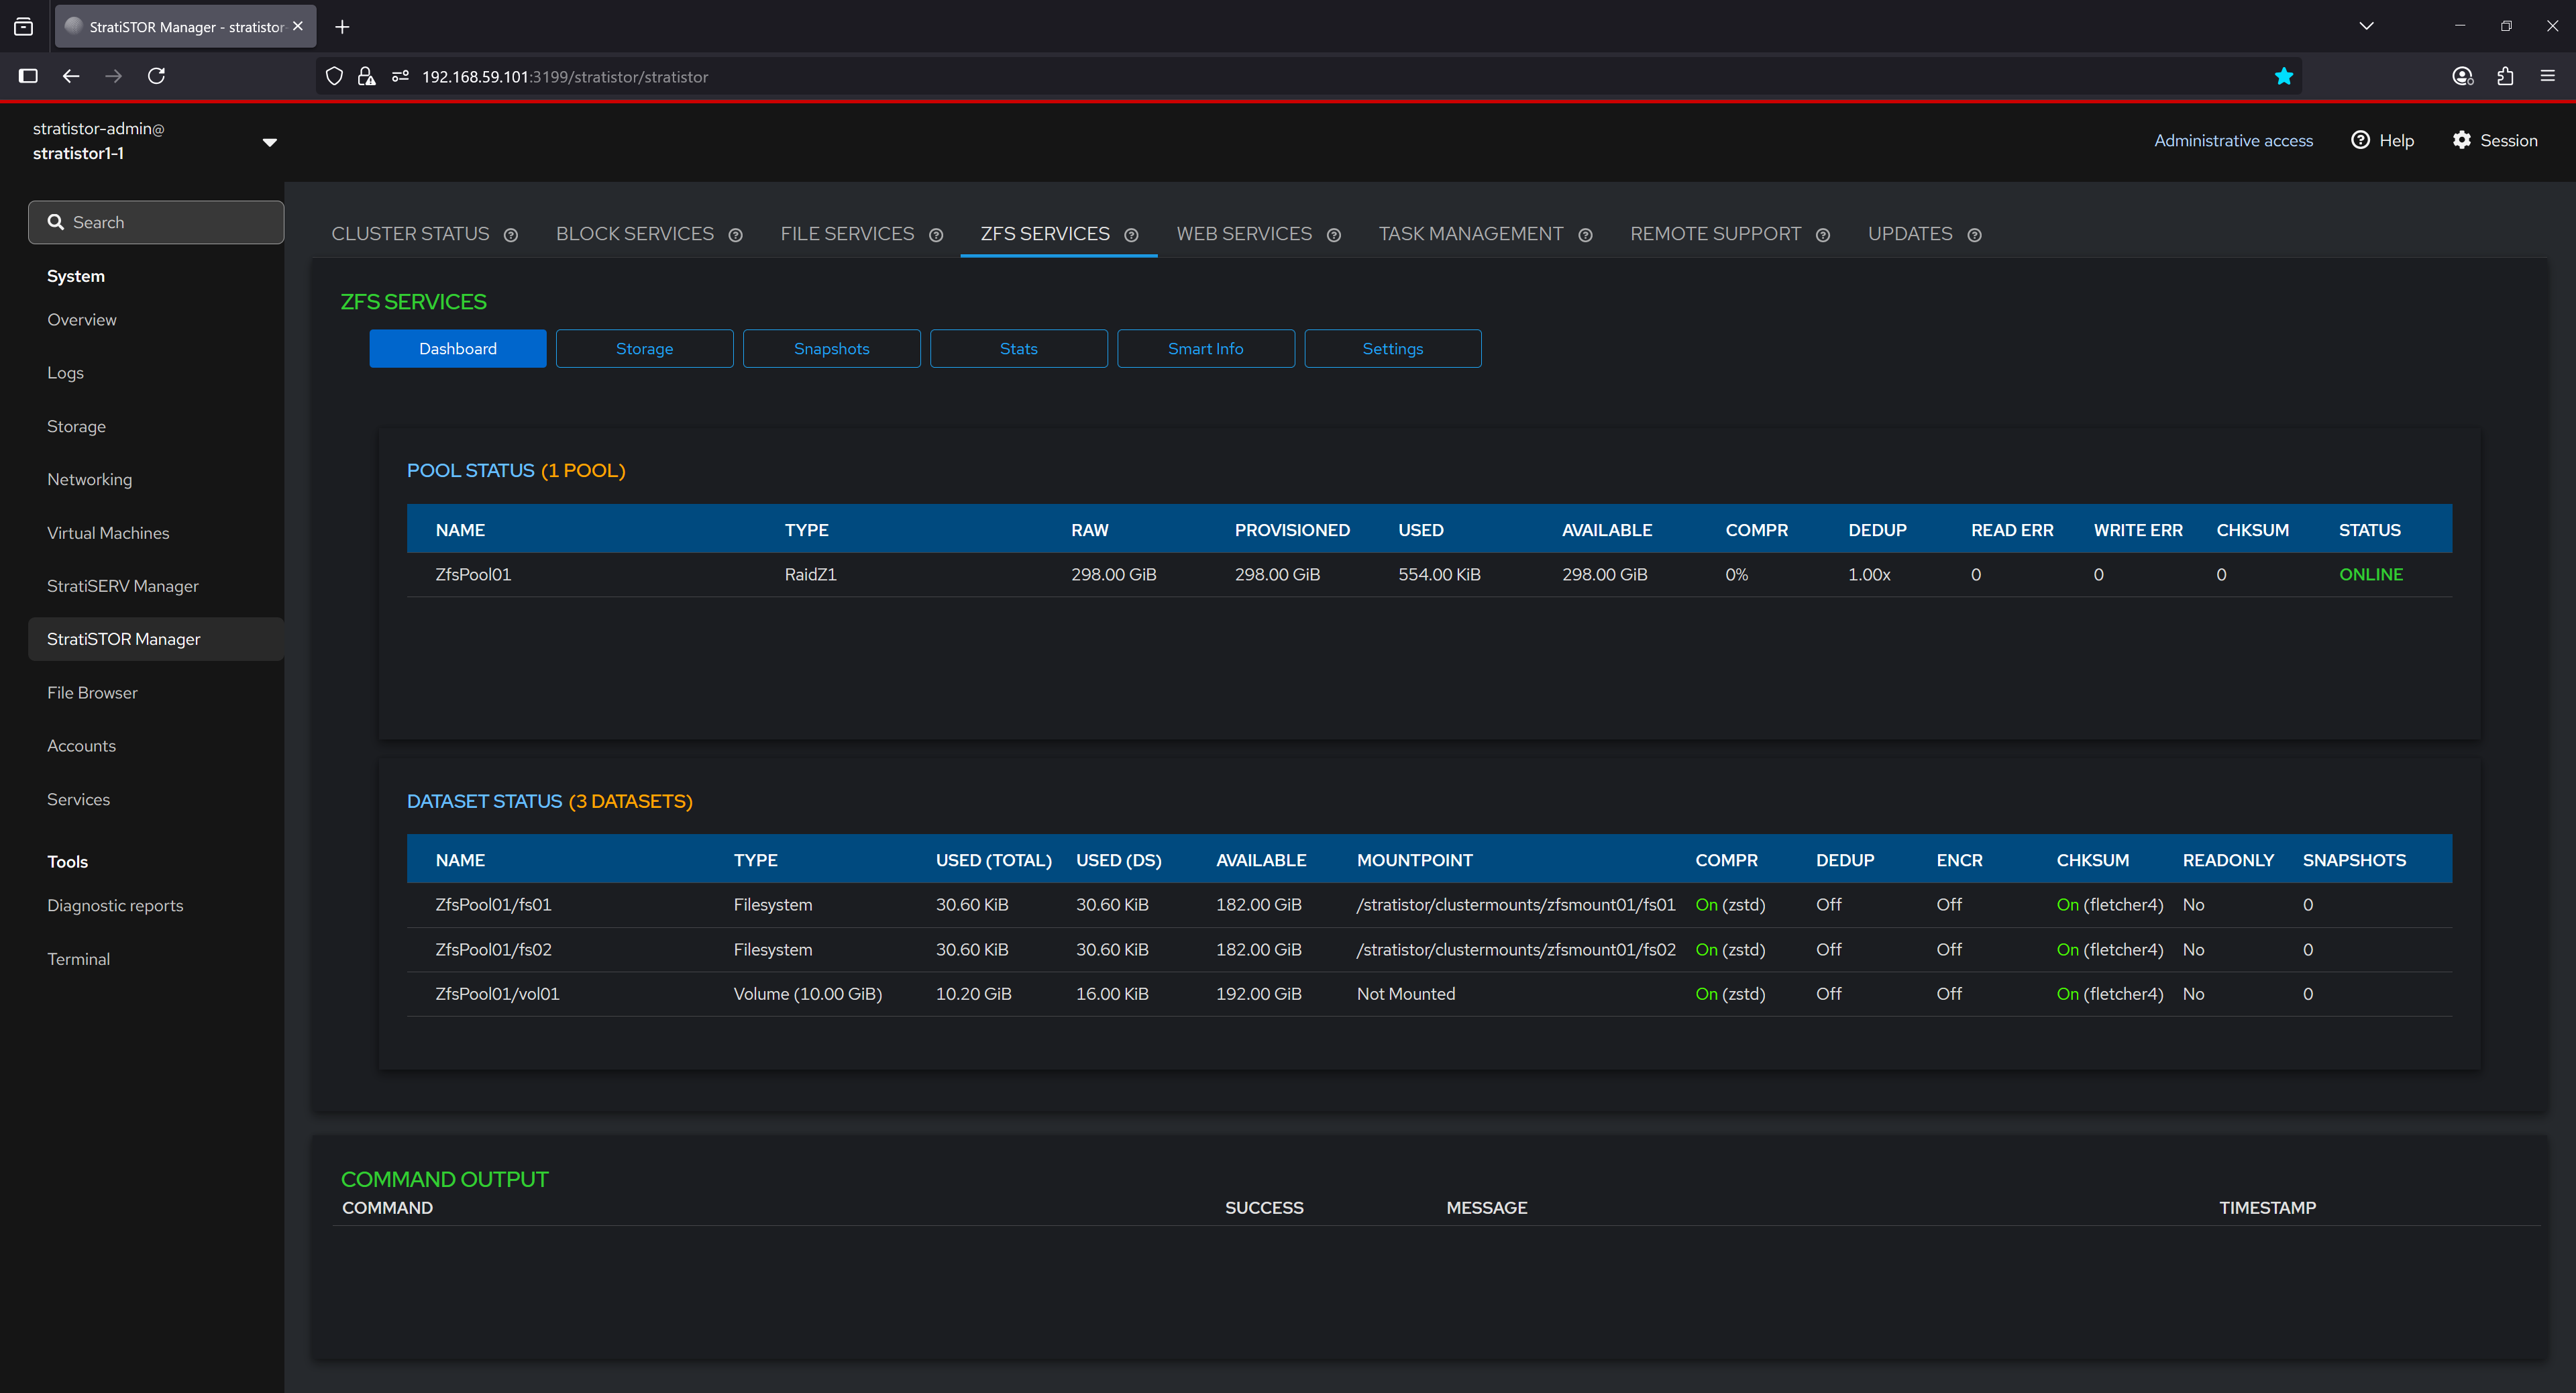
¶ ZFS SERVICES - DASHBOARD
The ZFS Dashboard provides a summarized view of the current pool and dataset configuration within the system. It displays vital information about pool health, including the RAID level, total provisioned space, used and available capacity, and error metrics such as read, write, and checksum errors. Dataset details are also presented, listing each filesystem and volume associated with the pool, their usage statistics, compression and deduplication status, encryption settings, mount points, and snapshot counts. This serves as a central point for monitoring the operational state of ZFS services.
¶ ZFS SERVICES - CLOUD STORAGE
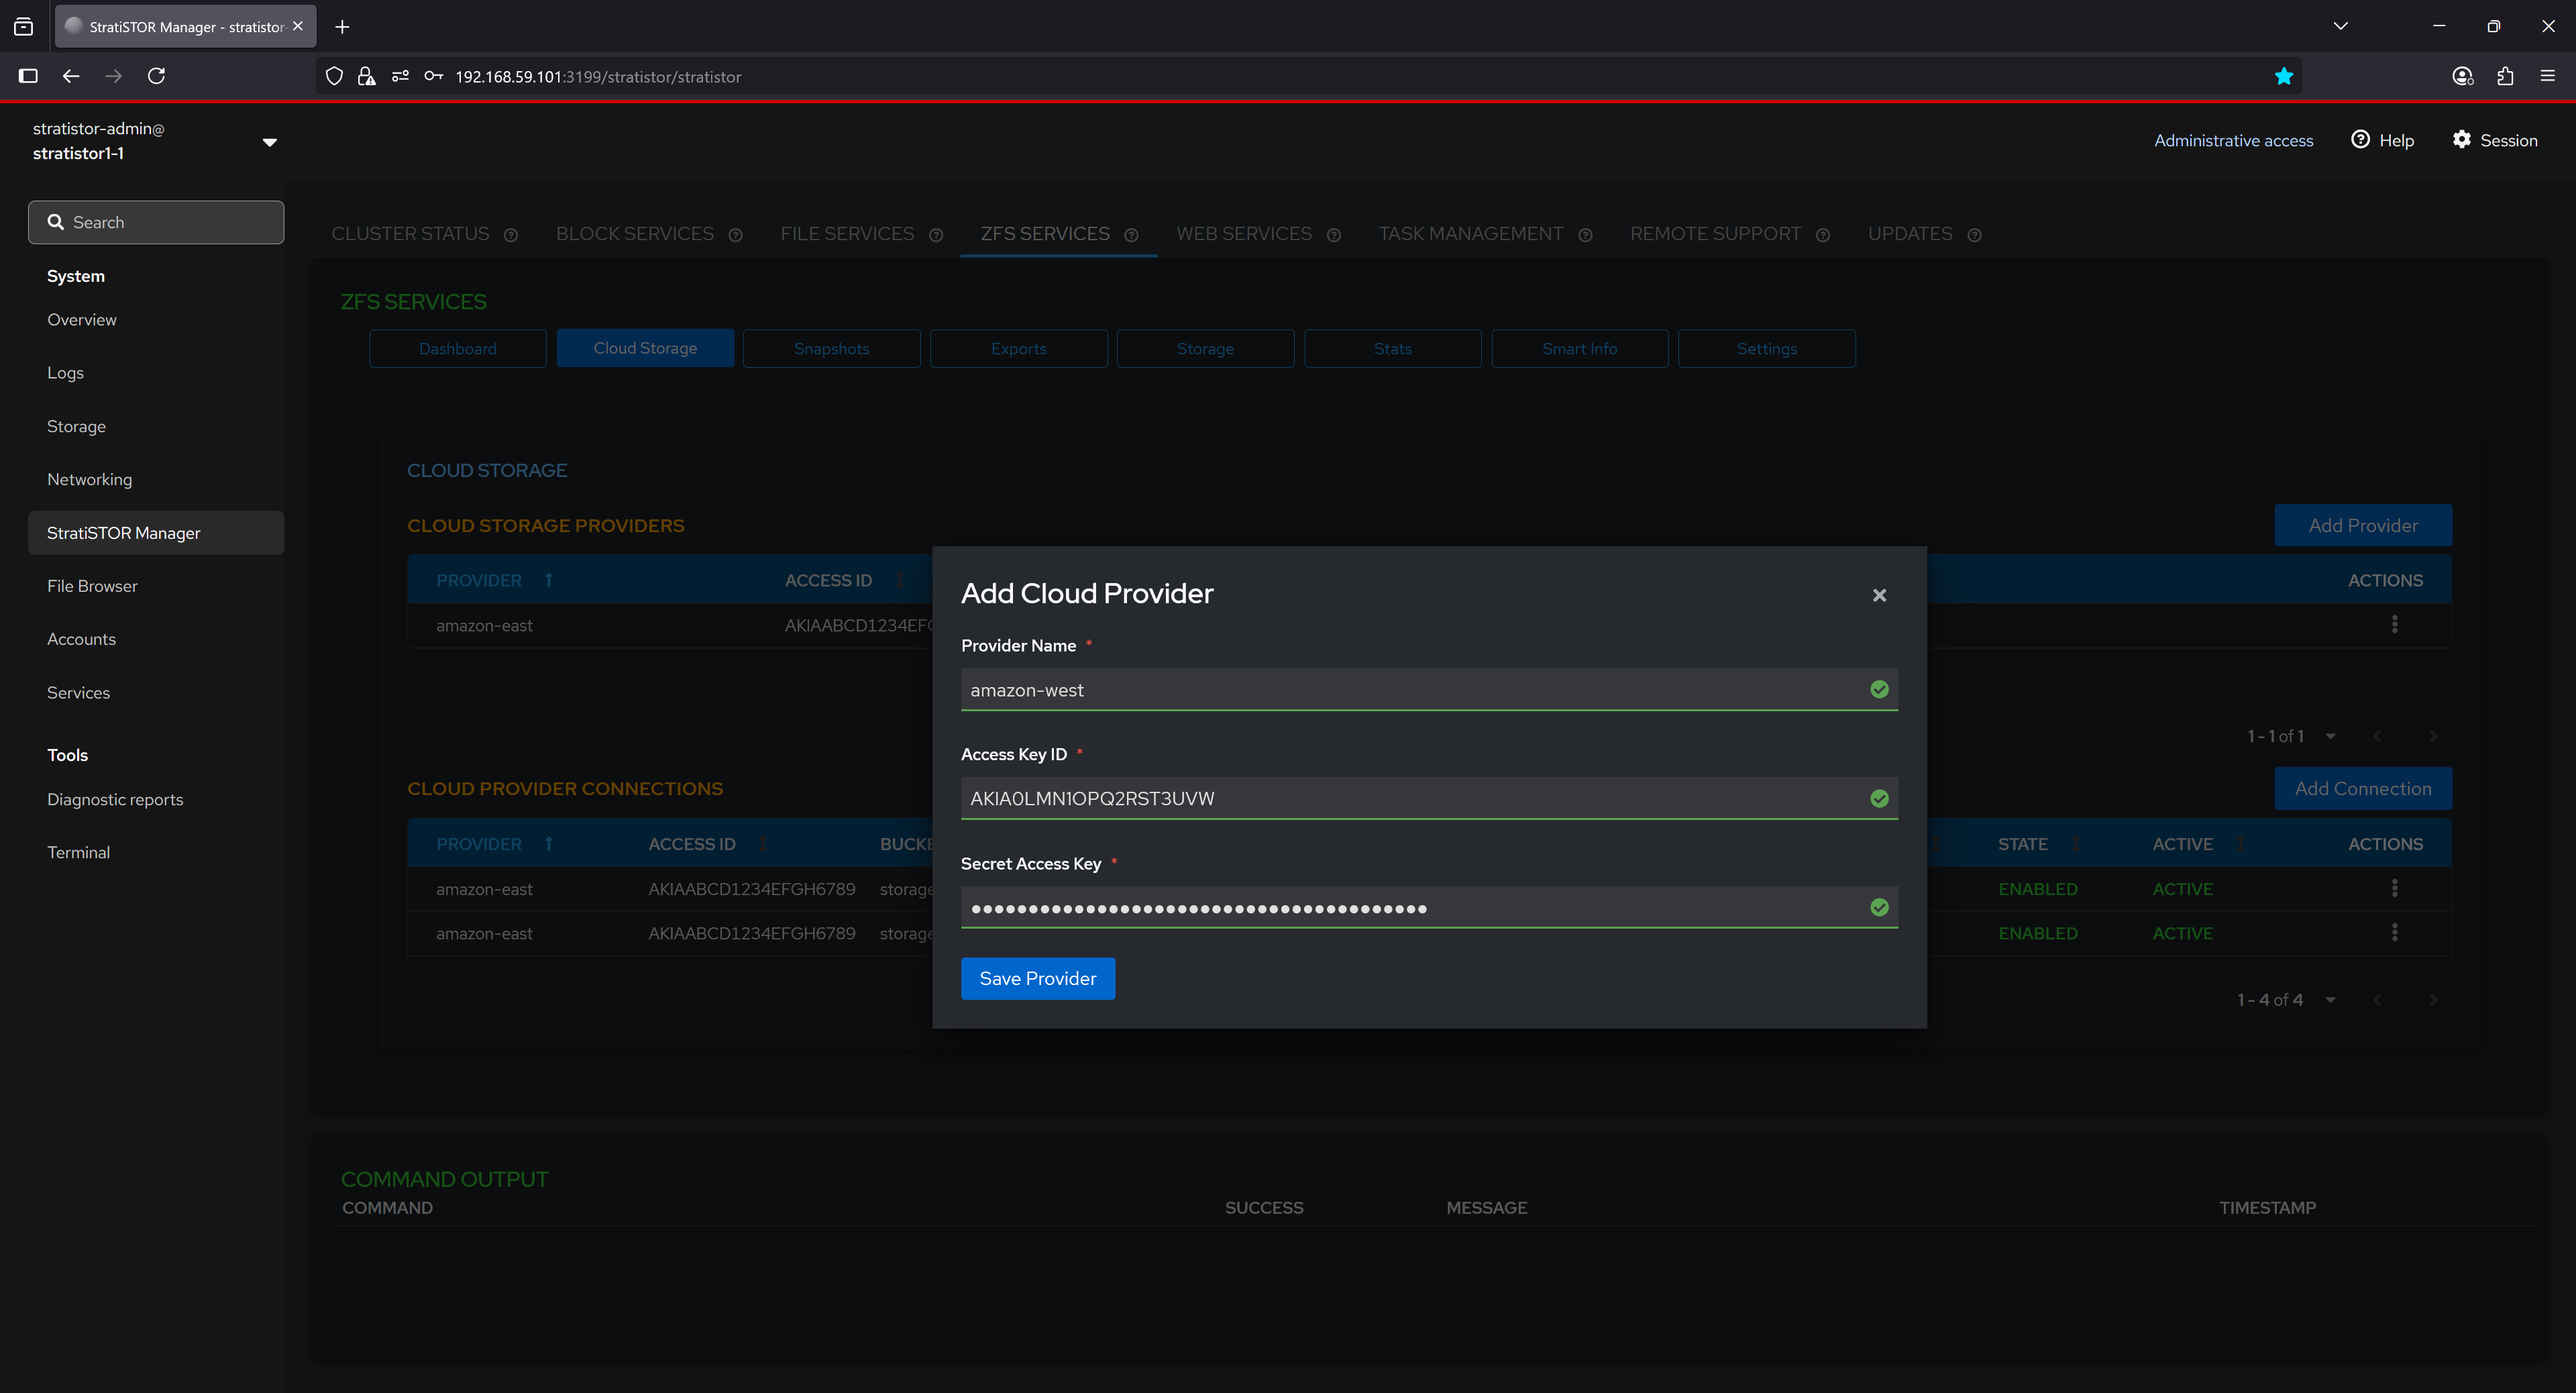
The Cloud Storage tab presents the operator with the ability to define cloud-backed storage service providers to be used as block devices. These block devices can be used as backing disks for ZFS pools or any other function within the platform.
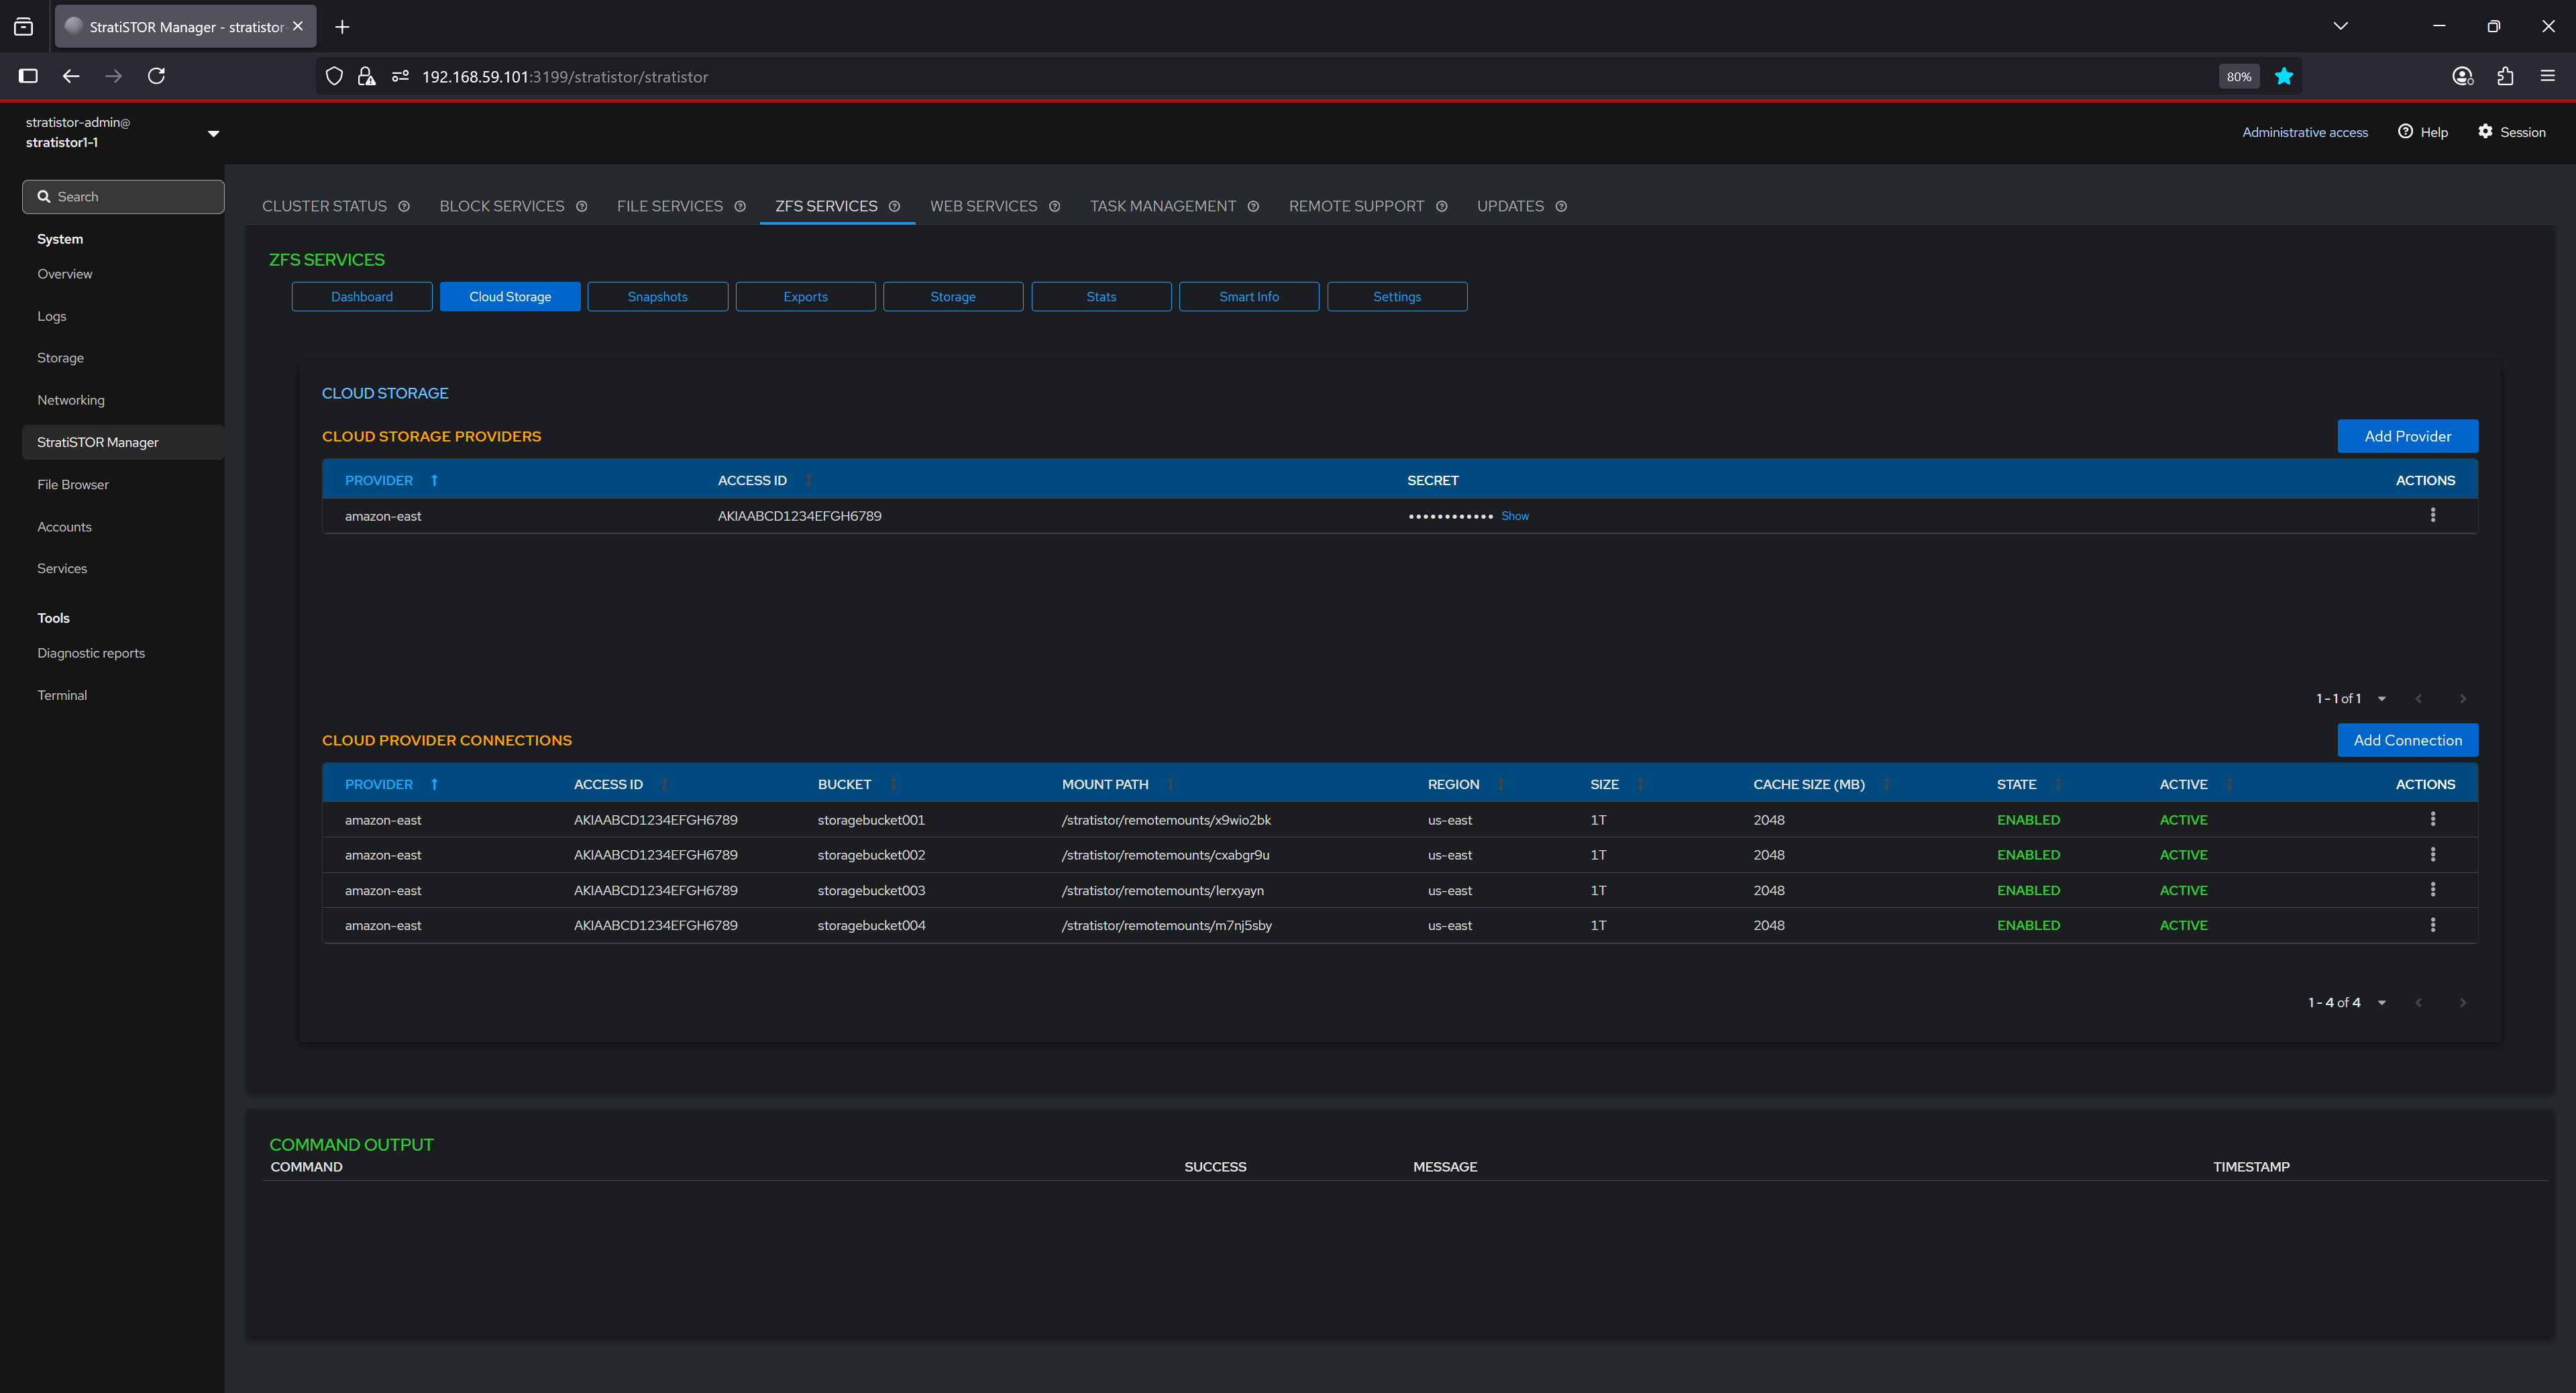
To being, click on the Add Provider button. This will open the Add Cloud Provider modal window. Enter the provide friendly name and provider specific Access Key ID and Secret Access Key pairs. When finished, click on the Save Provider button.
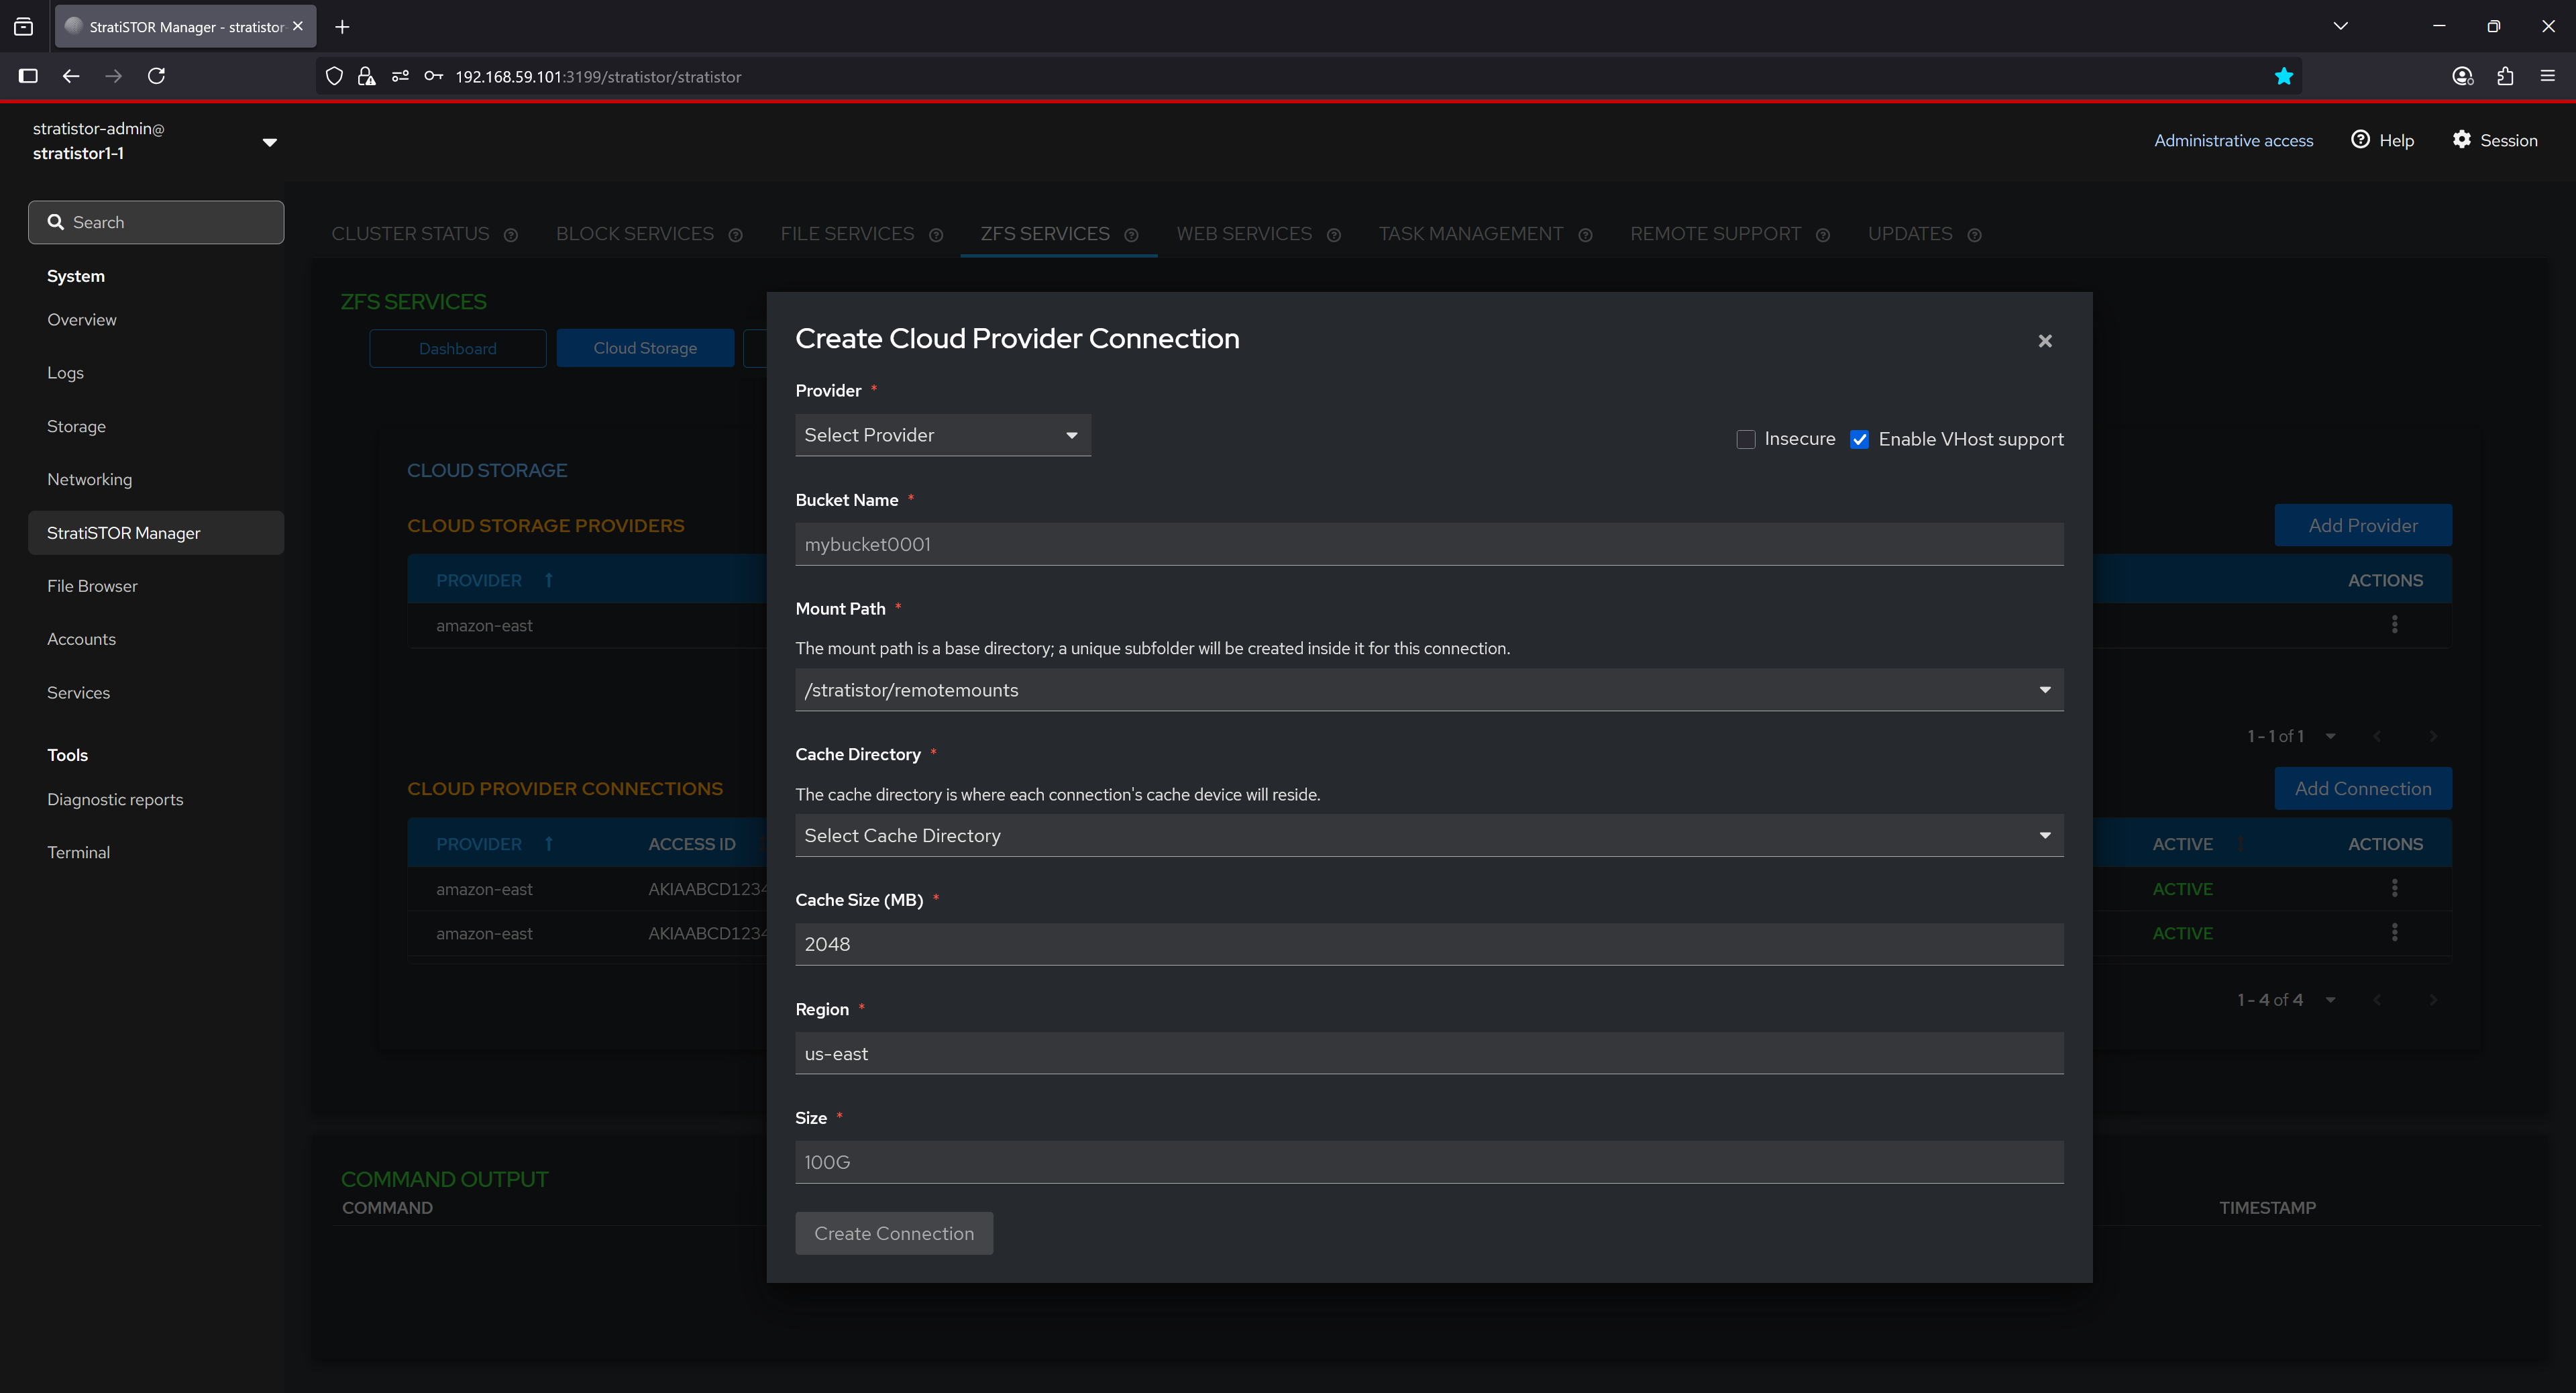
Next, define a cloud provide connection. Select the provider from the dropdown list, provide a unique bucket name for this connection, mount path where buckets will be mounted as block device, the cache directory where the cache files for the connection will be stored, the designated cache size in MBs, the region where the bucket originates from the provider, and the size of the block device to be created from the bucket.
¶ ZFS SERVICES - STORAGE
The Storage section visualizes the structural layout of ZFS storage using a hierarchical tree view. Each pool is displayed as a top-level node, under which associated filesystems and volumes are listed. This representation helps users intuitively understand the relationship between datasets and their parent pool, offering quick access to context-specific actions and configurations. It supports easy navigation and management of datasets within a graphical interface.
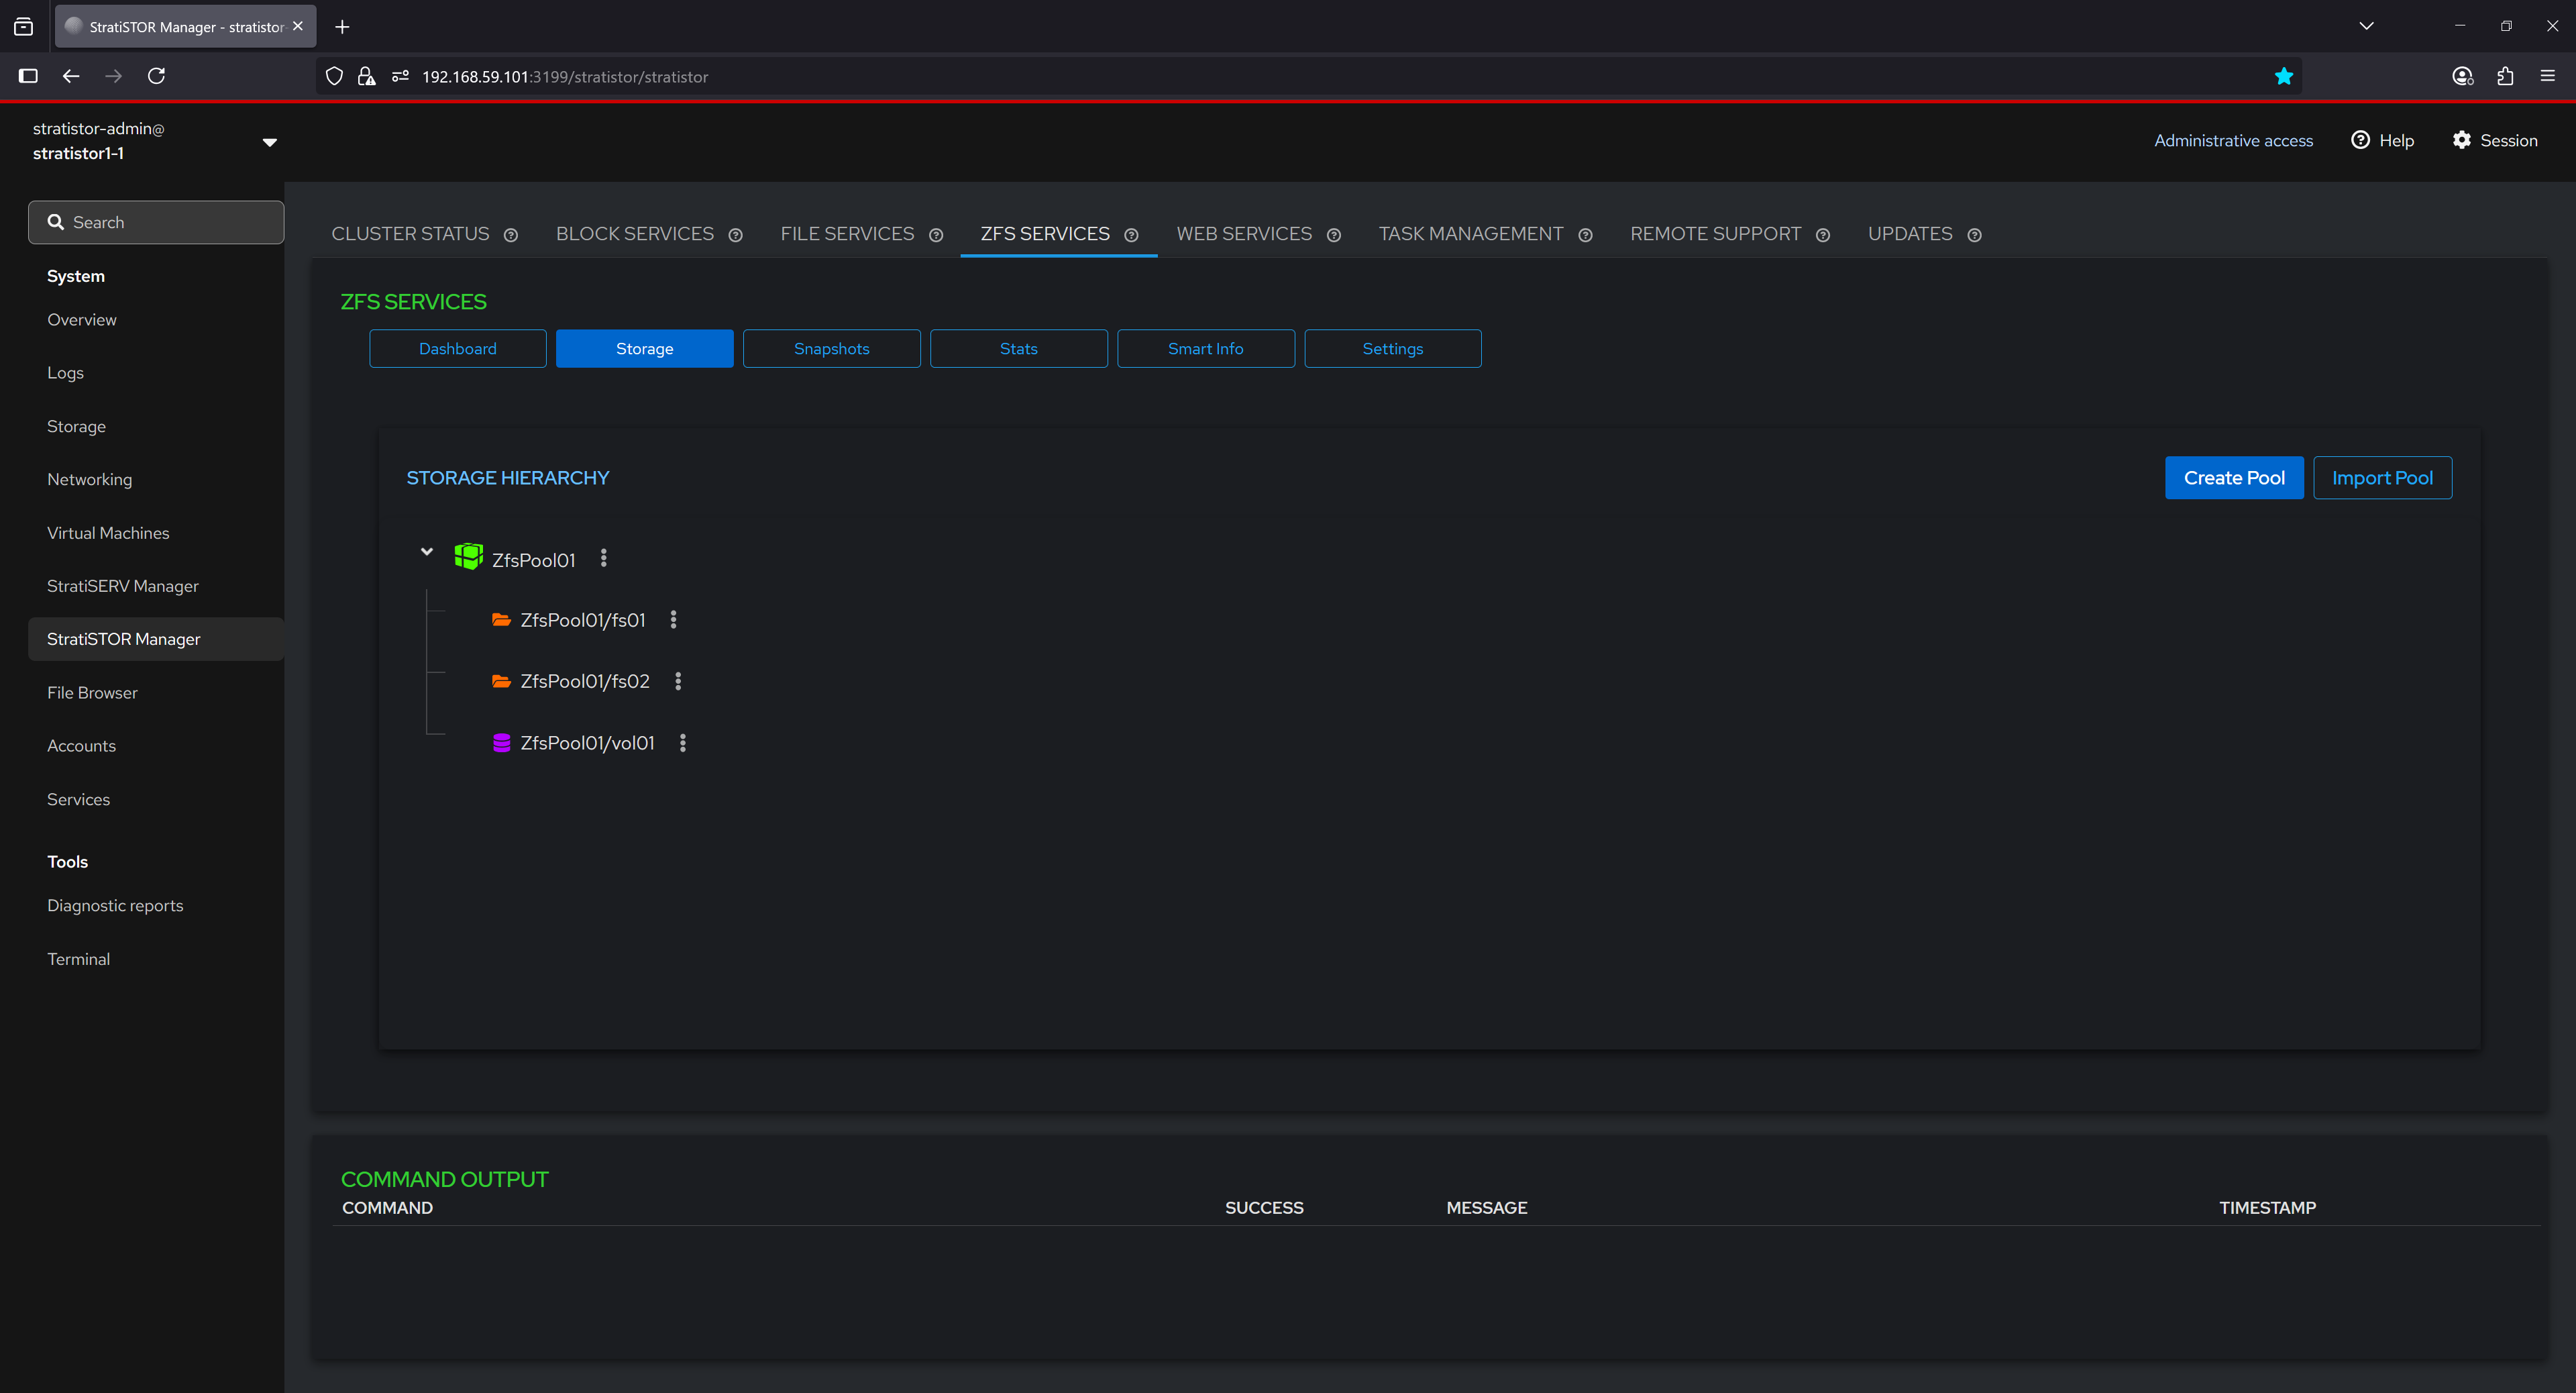
From the action menu for each object in the tree, the operator can:
|
|
|
¶ ZFS SERVICES - SNAPSHOTS
The Snapshots tab lists all snapshots associated with a selected dataset. Each entry includes the snapshot name, creation timestamp, data size used, whether the snapshot is held (protected from deletion), and whether it is currently mounted. This view enables users to audit the state of point-in-time copies for rollback or recovery purposes and provides controls for managing individual snapshot lifecycles.
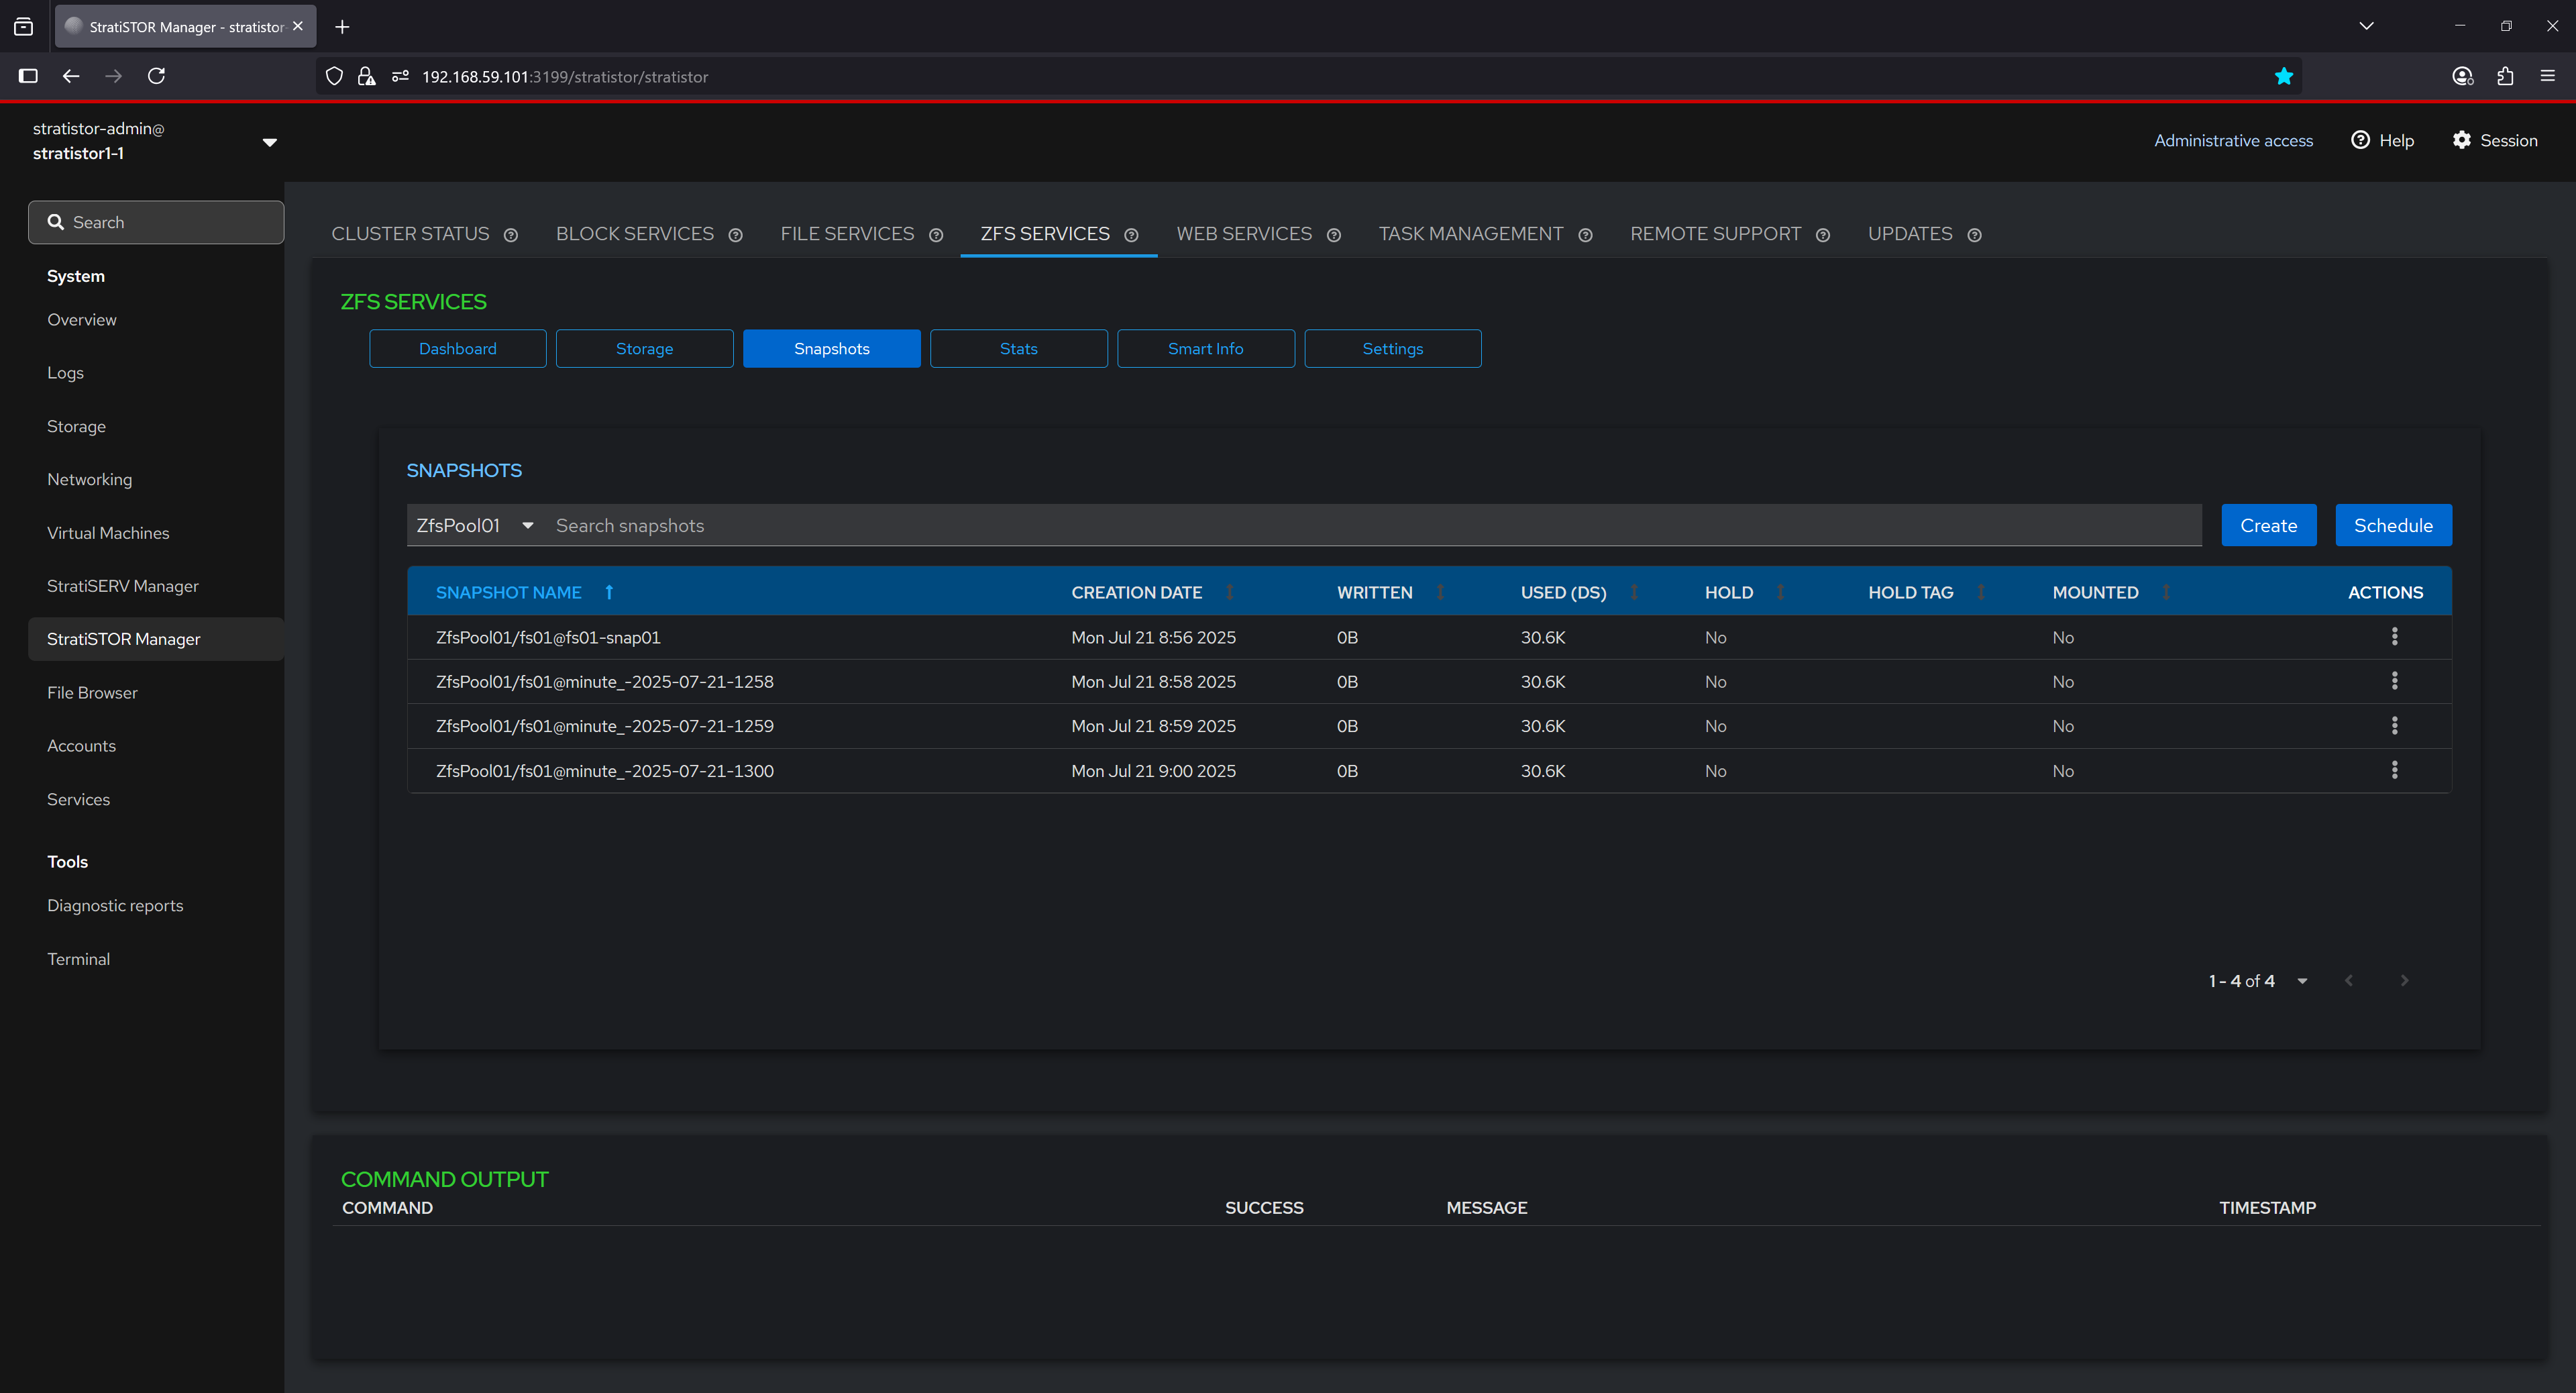
From the action menu for each snapshot in the table, the operator can:
- Create Snapshots – Manually generate a point-in-time copy of a dataset or volume.
- Delete Snapshots – Permanently remove a selected snapshot from the system.
- Hold Snapshots – Prevent deletion of a snapshot by placing a hold on it.
- Release Snapshots – Remove a previously applied hold, allowing deletion.
- Rollback to a Snapshot – Revert the dataset or volume to the state captured by the snapshot.
- Schedule a Snapshot – Define an automated recurring snapshot creation rule.
- Show Differences Between Snapshots – Display changes between two snapshots or snapshot and current state.
- Promote Snapshots – Make a clone’s snapshot the new origin, detaching it from its parent.
- Mount Snapshots – Temporarily mount a snapshot for read-only access or inspection.
- Unmount Snapshots – Detach a previously mounted snapshot from the filesystem.
- Rename Snapshots – Change the name of an existing snapshot.
- Clone Snapshots – Create a writable clone from a snapshot for testing or development.
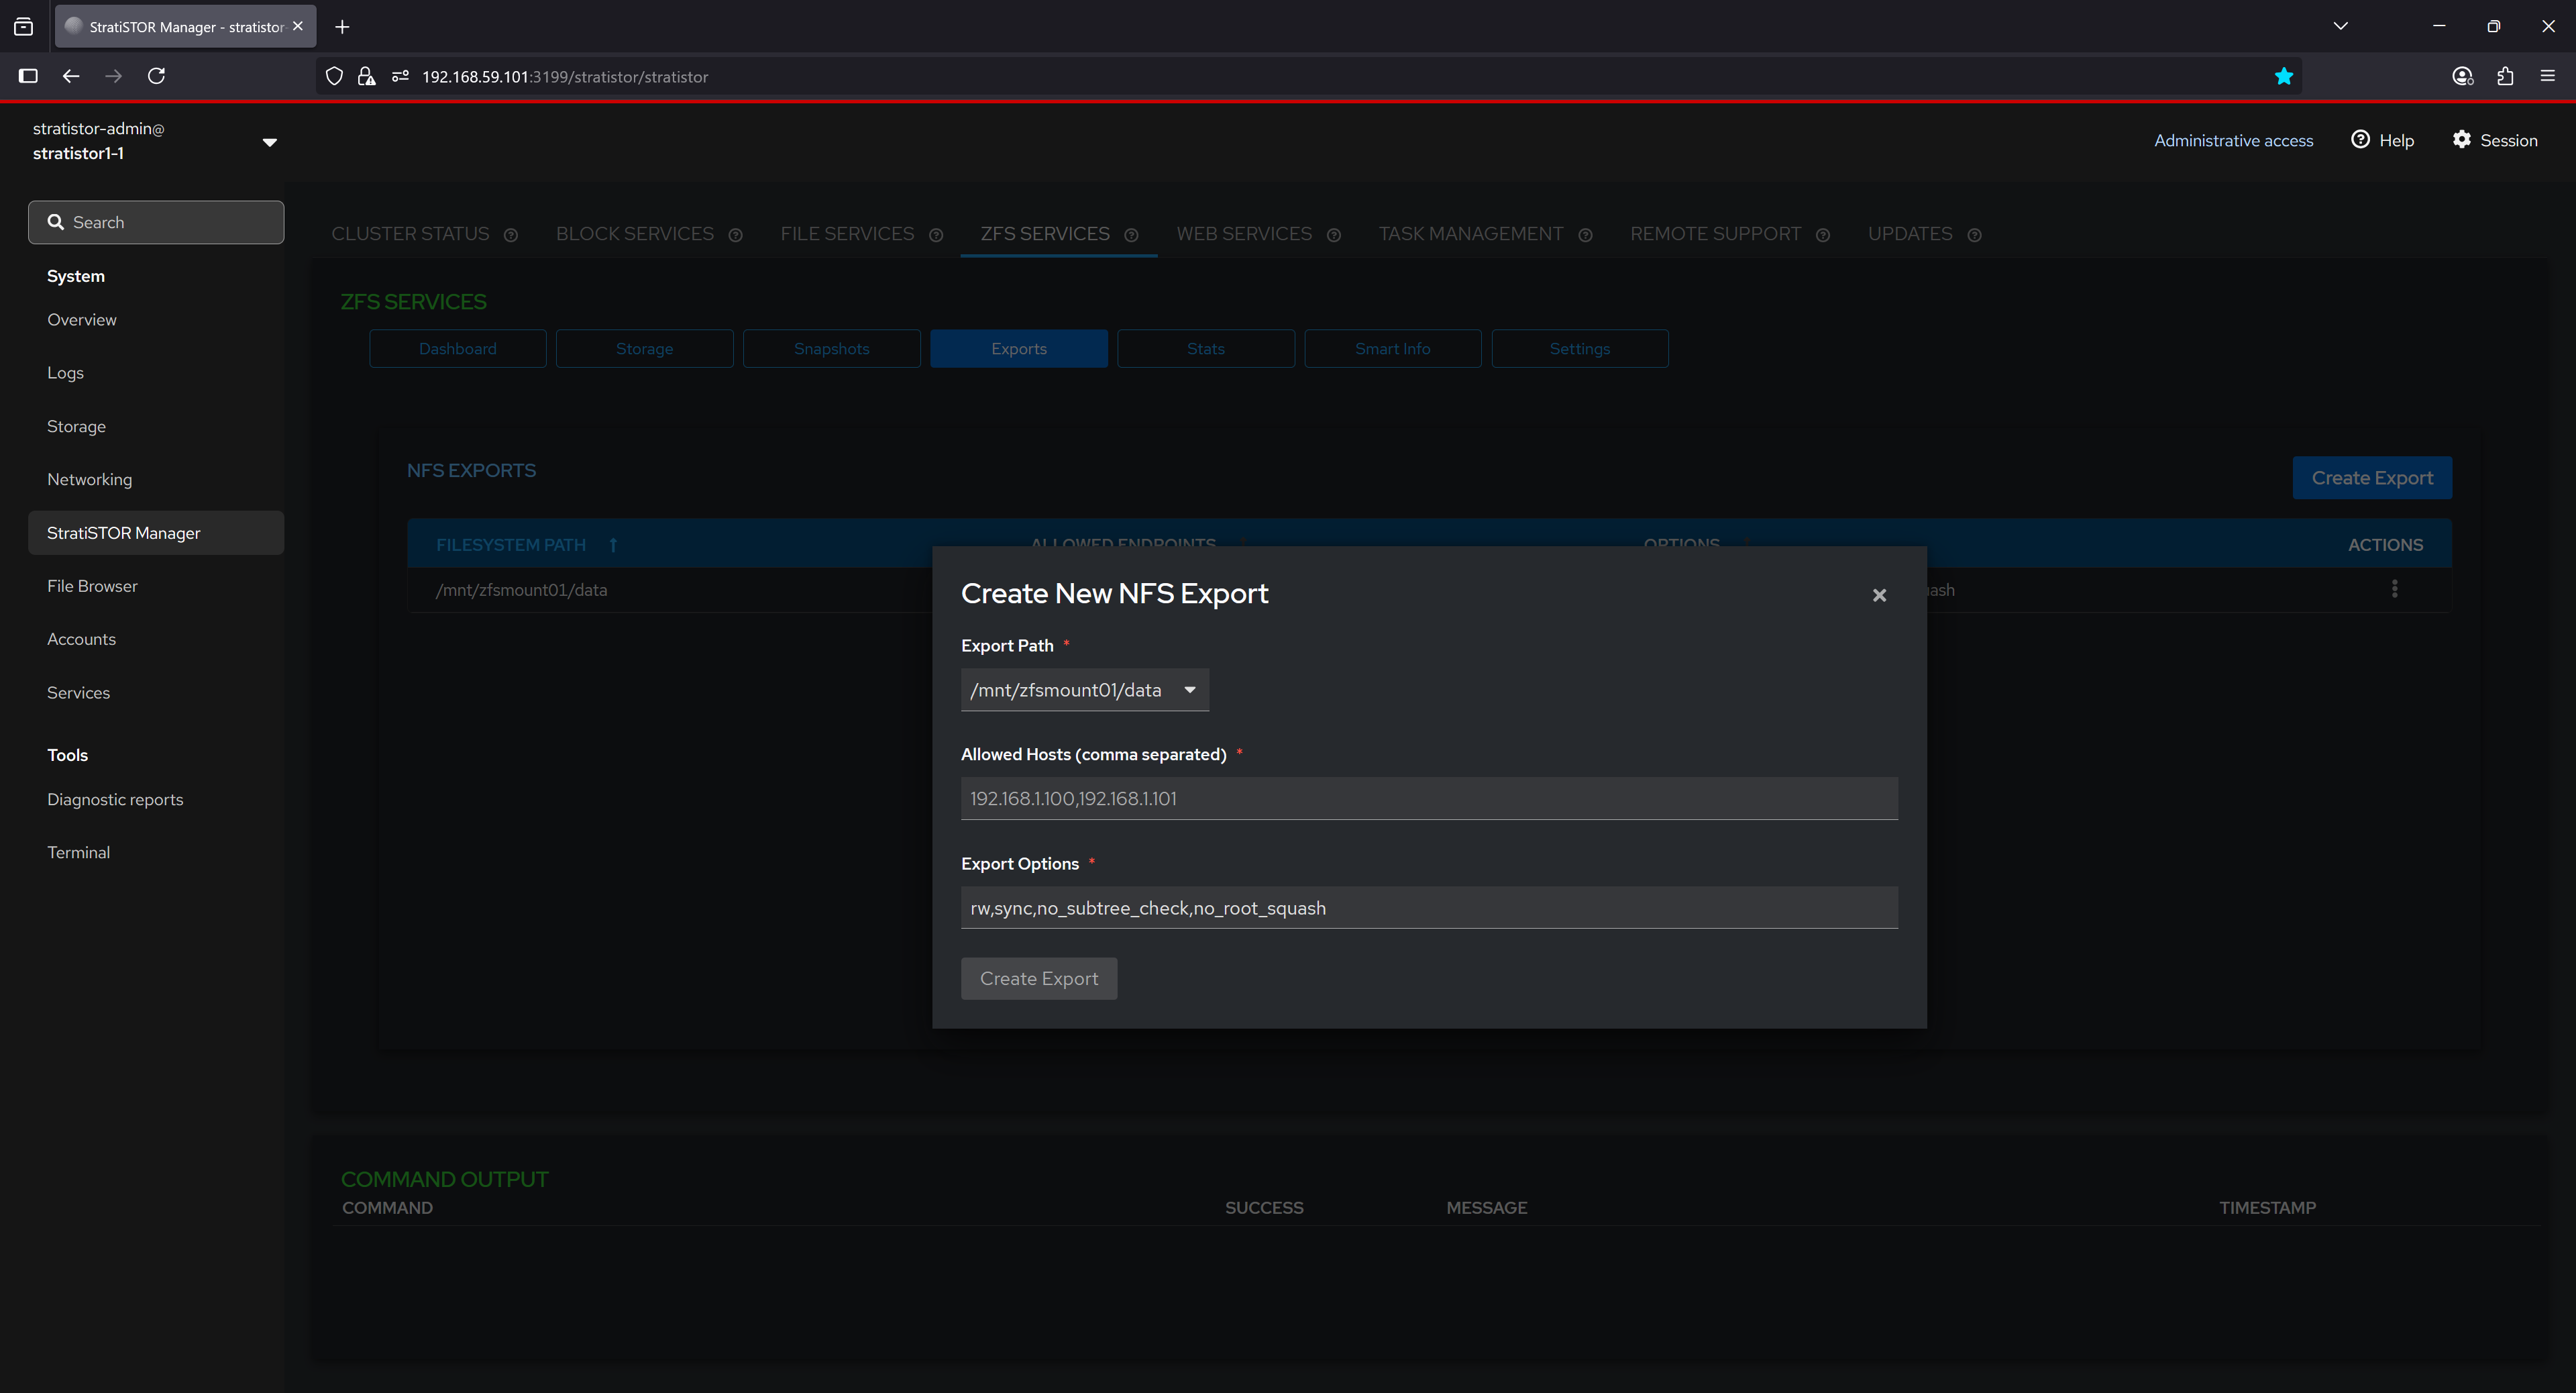
¶ ZFS SERVICES - EXPORTS
The Exports tab lists all NFS exports that are active on the current system. Exports allow you to share ZFS-backed filesystems over NFS, enabling seamless access from remote systems on your network. Each export defines the filesystem path, the range of allowed client endpoints, and specific NFS options controlling access, performance, and security. This configuration provides fine-grained control over how datasets are accessed, ensuring both flexibility and efficiency in network-based storage environments.
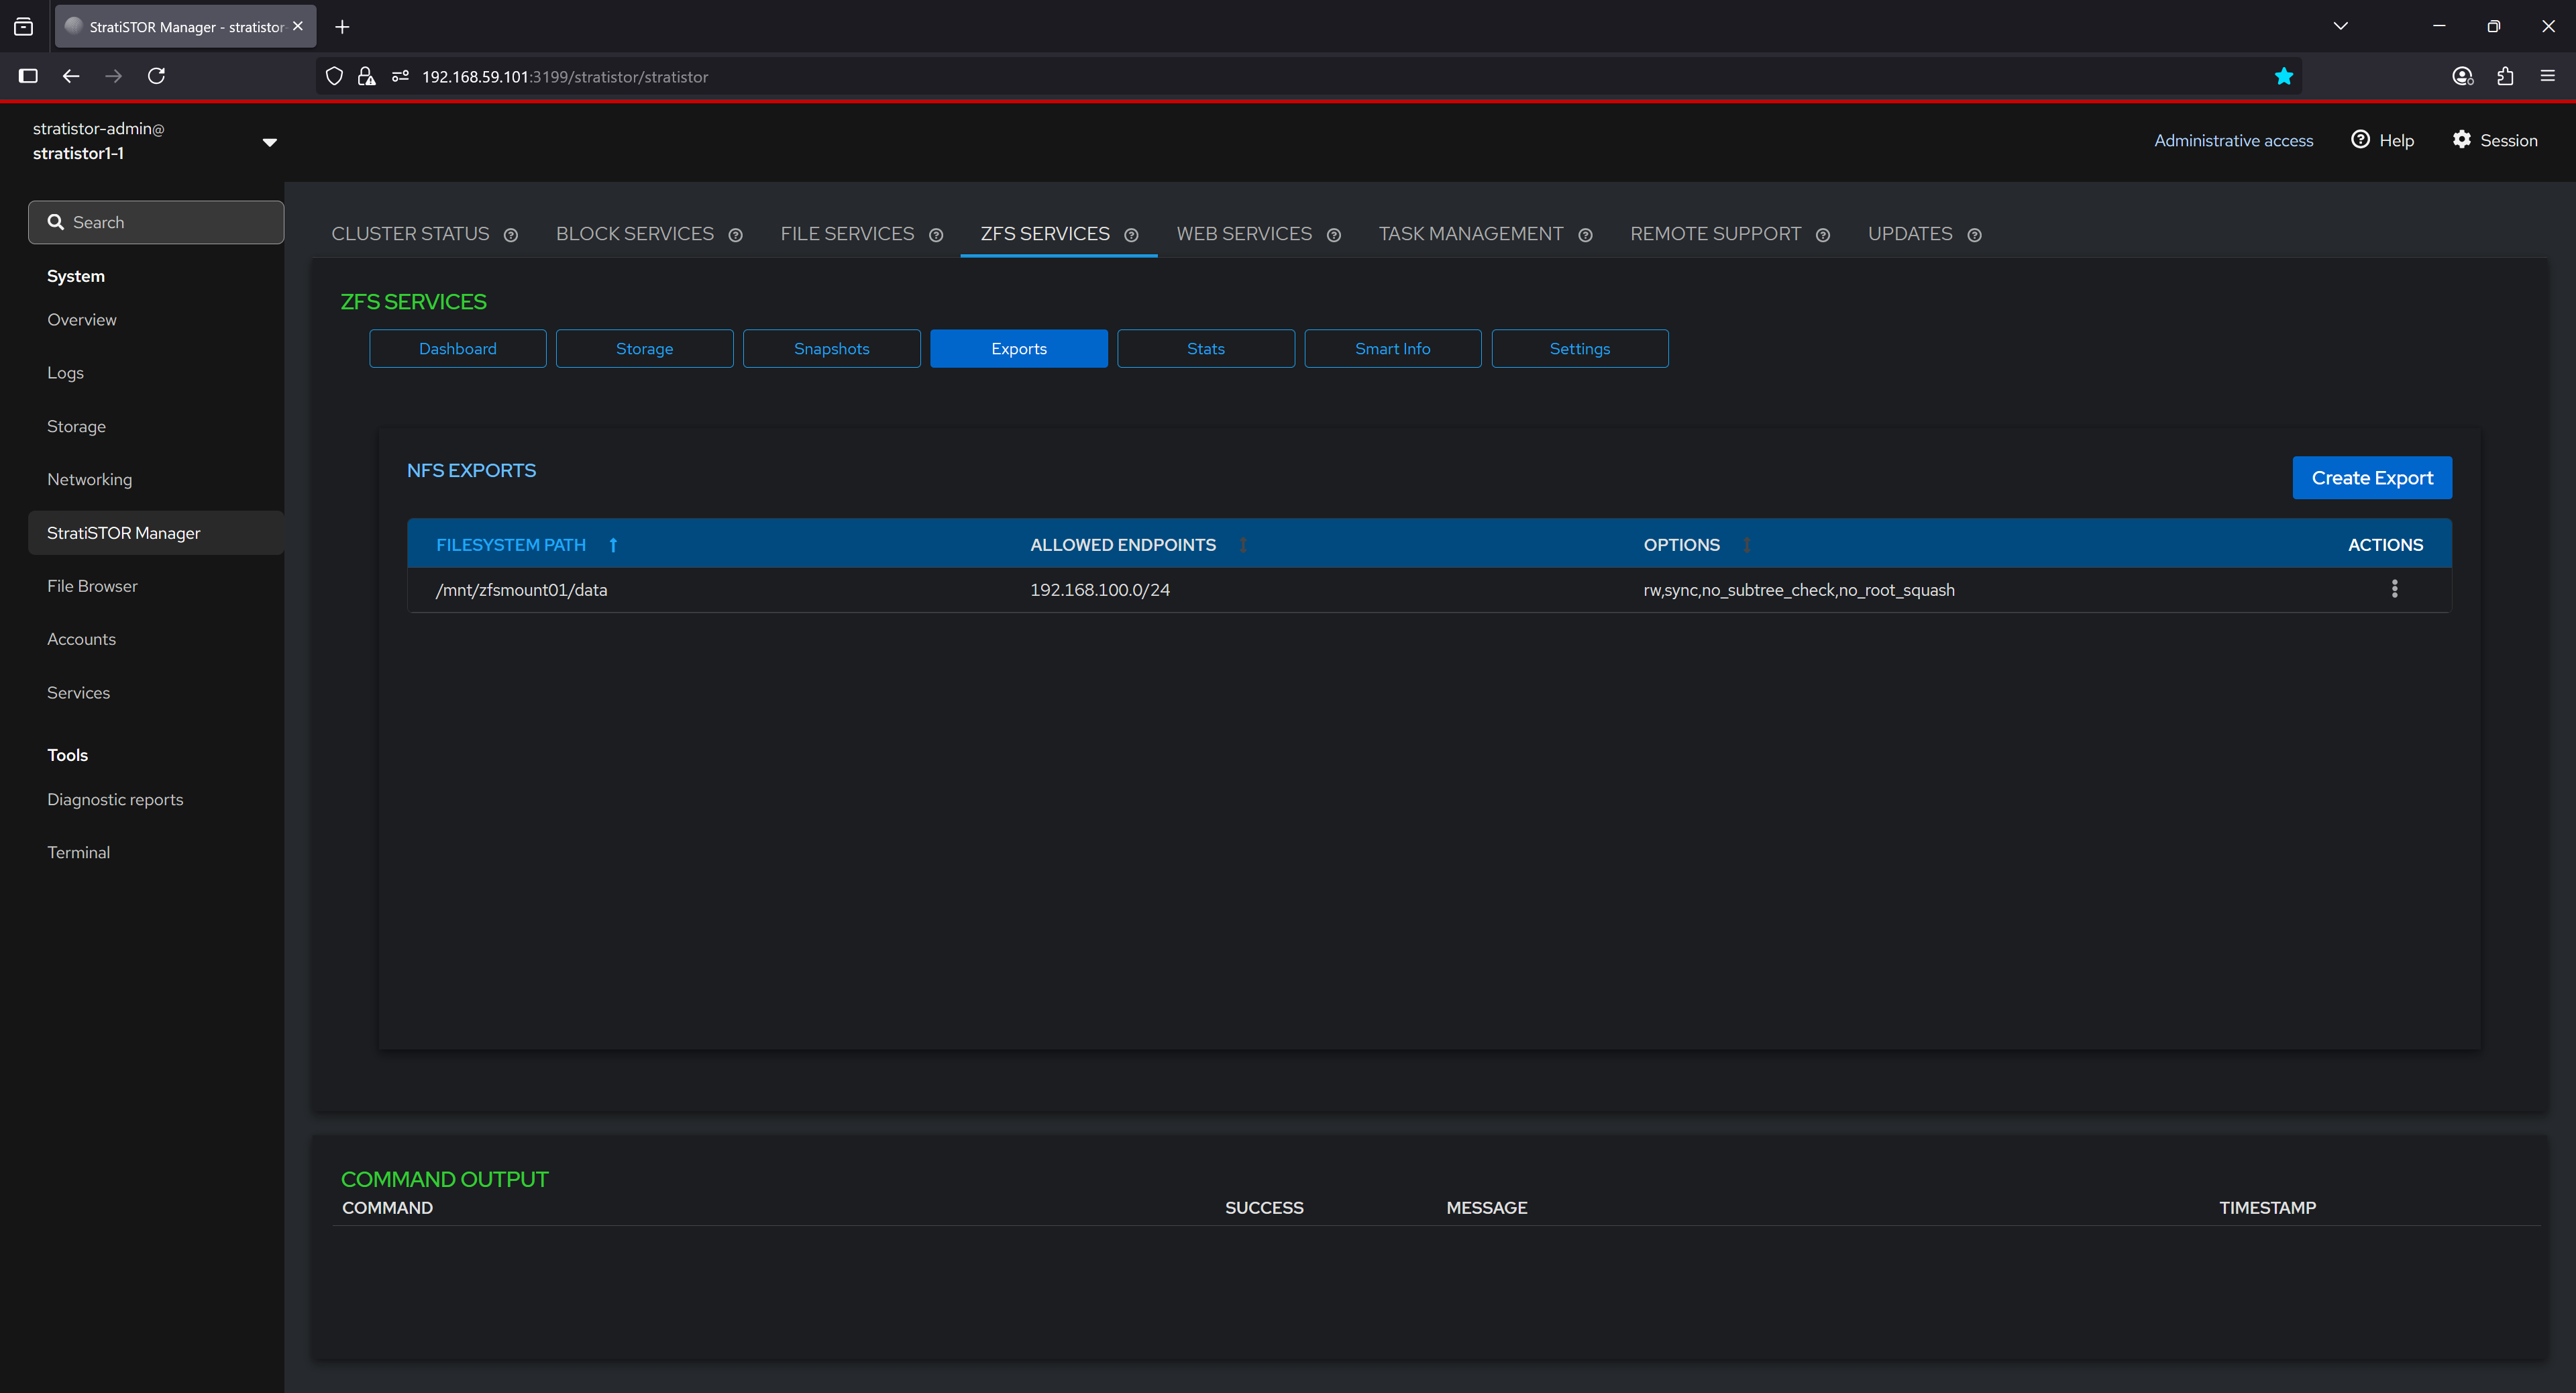
Exports can be mounted by all nodes within the cluster, or by any authorized NFS client on the local network, providing a versatile and high-performance way to share data across systems. Because ZFS can be backed by any physical disk type—including local disks, cluster-attached storage, SSDs, HDDs, or even a mix of different devices—it allows storage pools to be created from diverse storage resources. This flexibility means exports are not limited to cluster disks, enabling administrators to aggregate capacity and performance from a wide range of hardware into a unified pool. These pools can host datasets that take full advantage of ZFS’s advanced features, including inline compression, deduplication to eliminate duplicate data blocks and save space, snapshots for point-in-time recovery, replication for disaster recovery, and end-to-end data integrity verification.
Once an export is defined in the ZFS Services interface, it becomes immediately available for mounting within the cluster. Using the Storage tab and the New NFS Mount option, administrators can quickly mount the export to any node, ensuring consistent access paths, centralized management, and optimal utilization of all available storage resources.
¶ ZFS SERVICES - SNAPSHOTS (SCHEDULING)
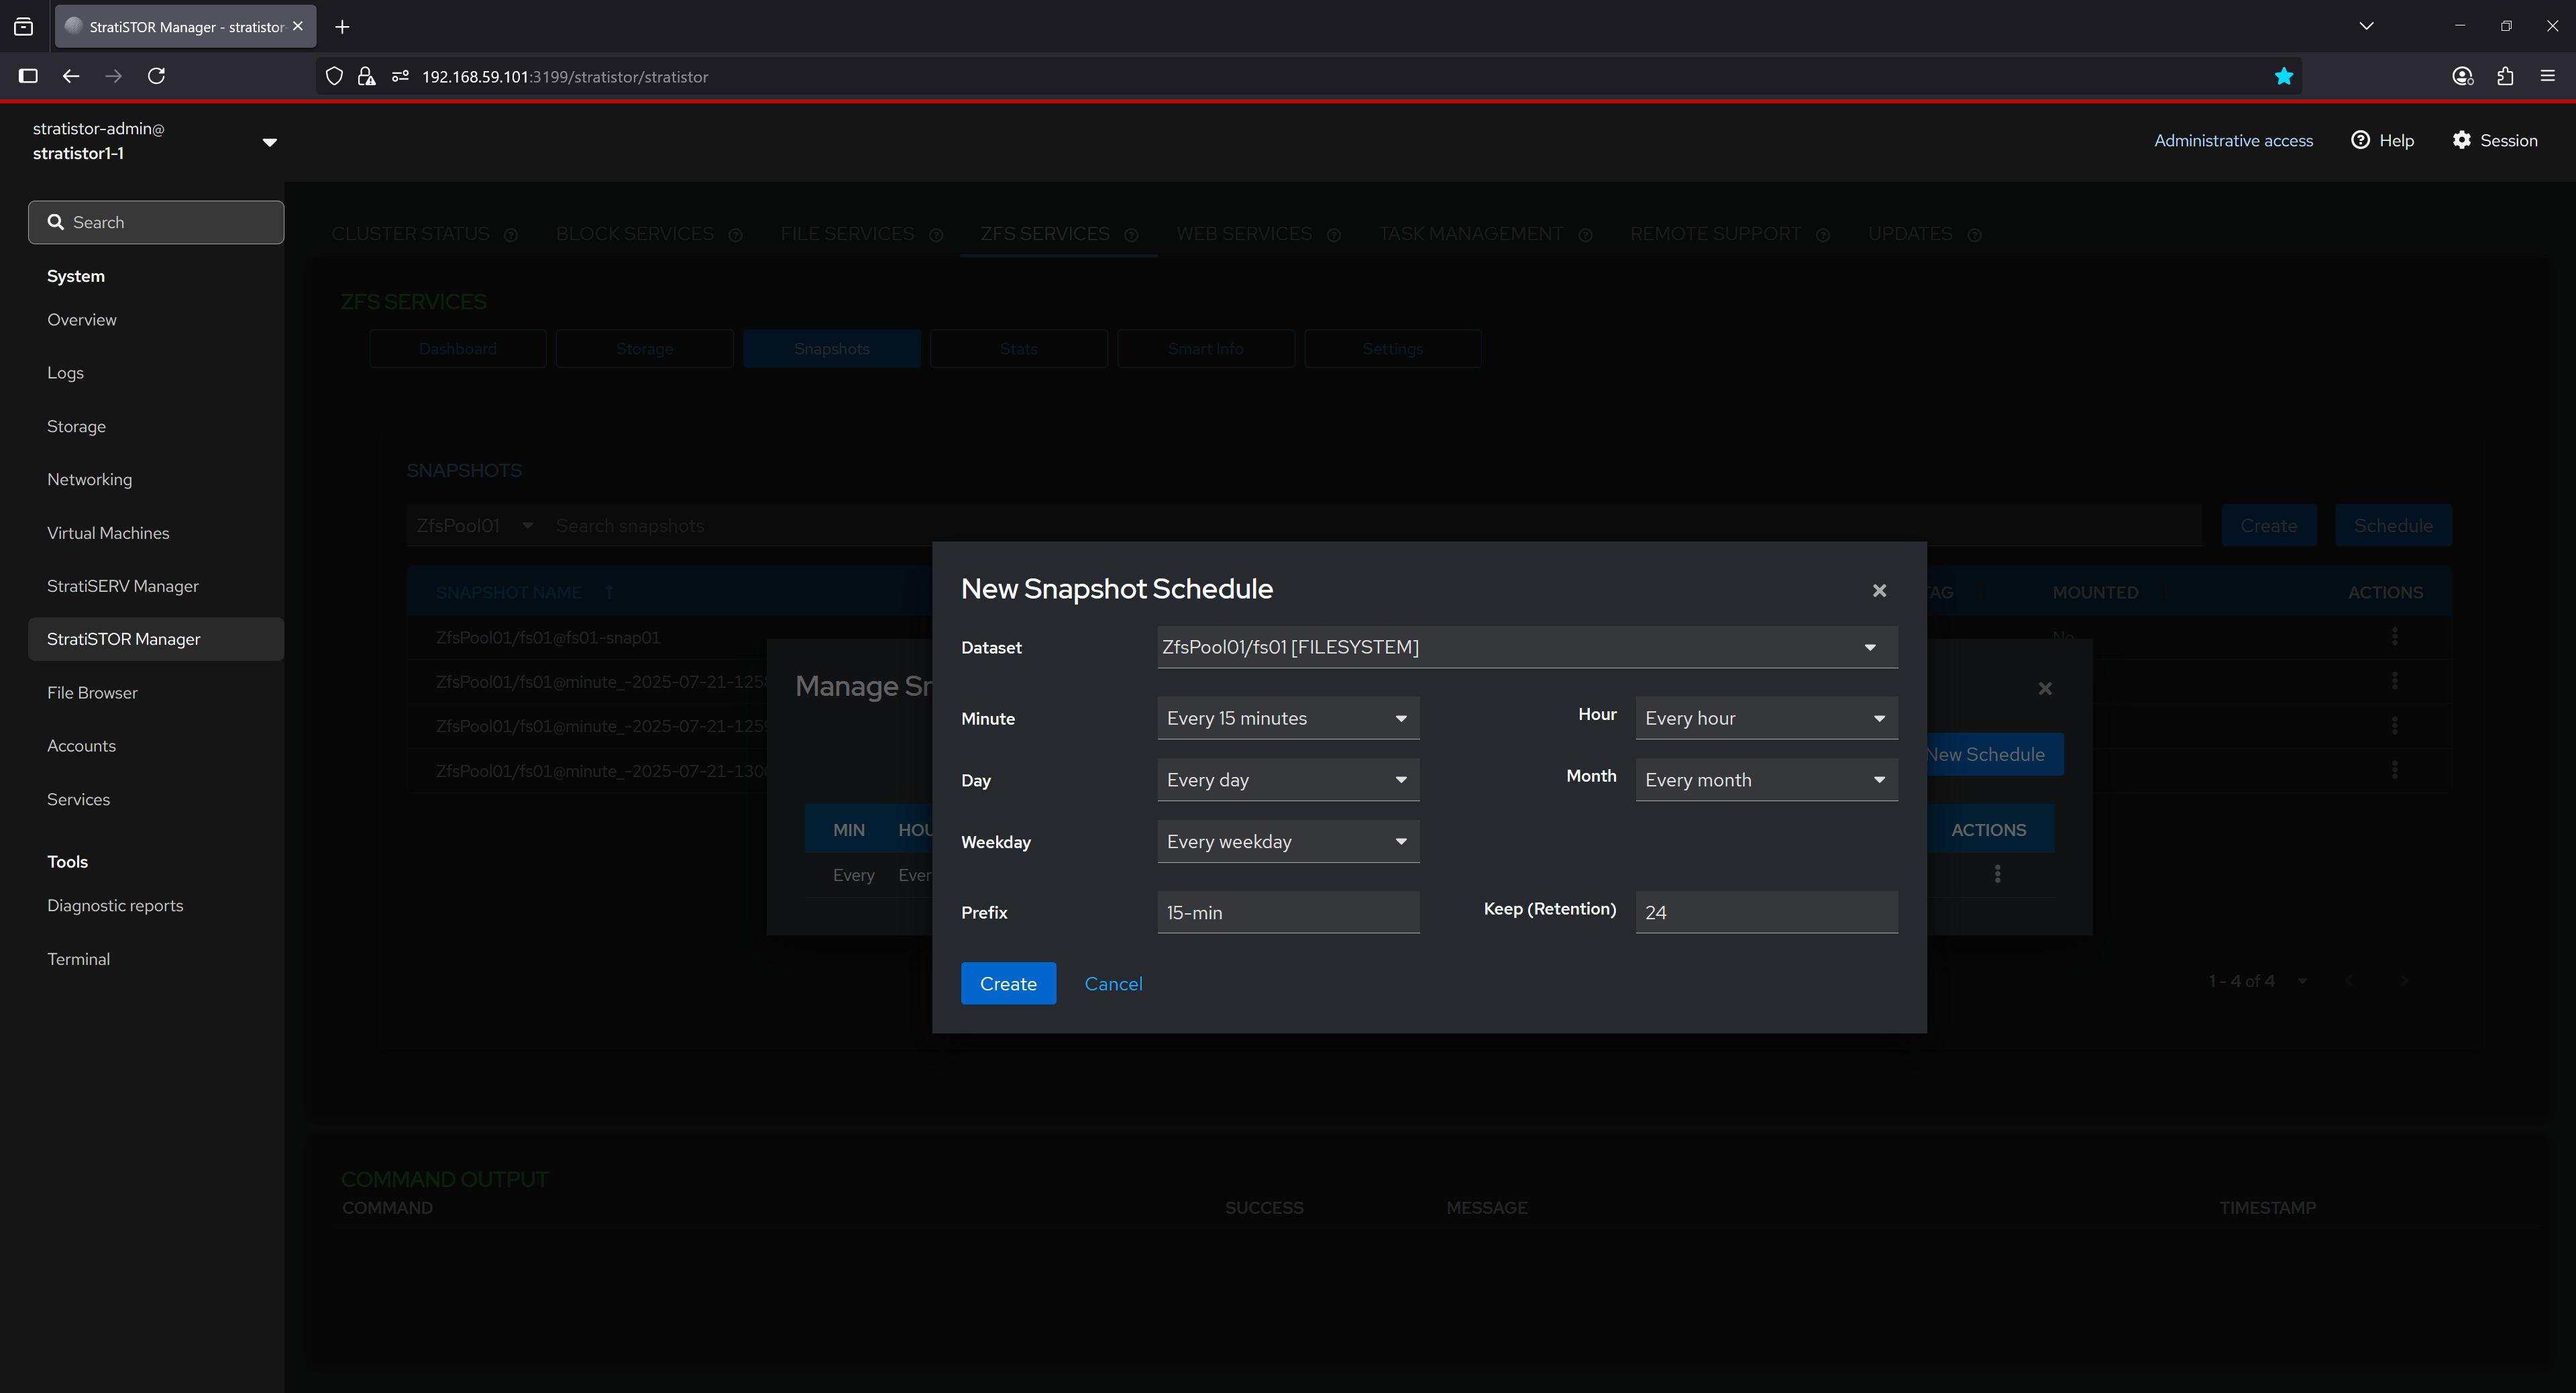
The Snapshot Schedules interface provides an overview of all active snapshot schedules. Each row includes the scheduling interval defined in CRON-like terms (minute, hour, day, etc.), the prefix used in naming the snapshots, retention count (number of snapshots to keep), and the target dataset. This feature helps ensure consistent data protection policies are applied by automating the creation of snapshots at regular intervals.
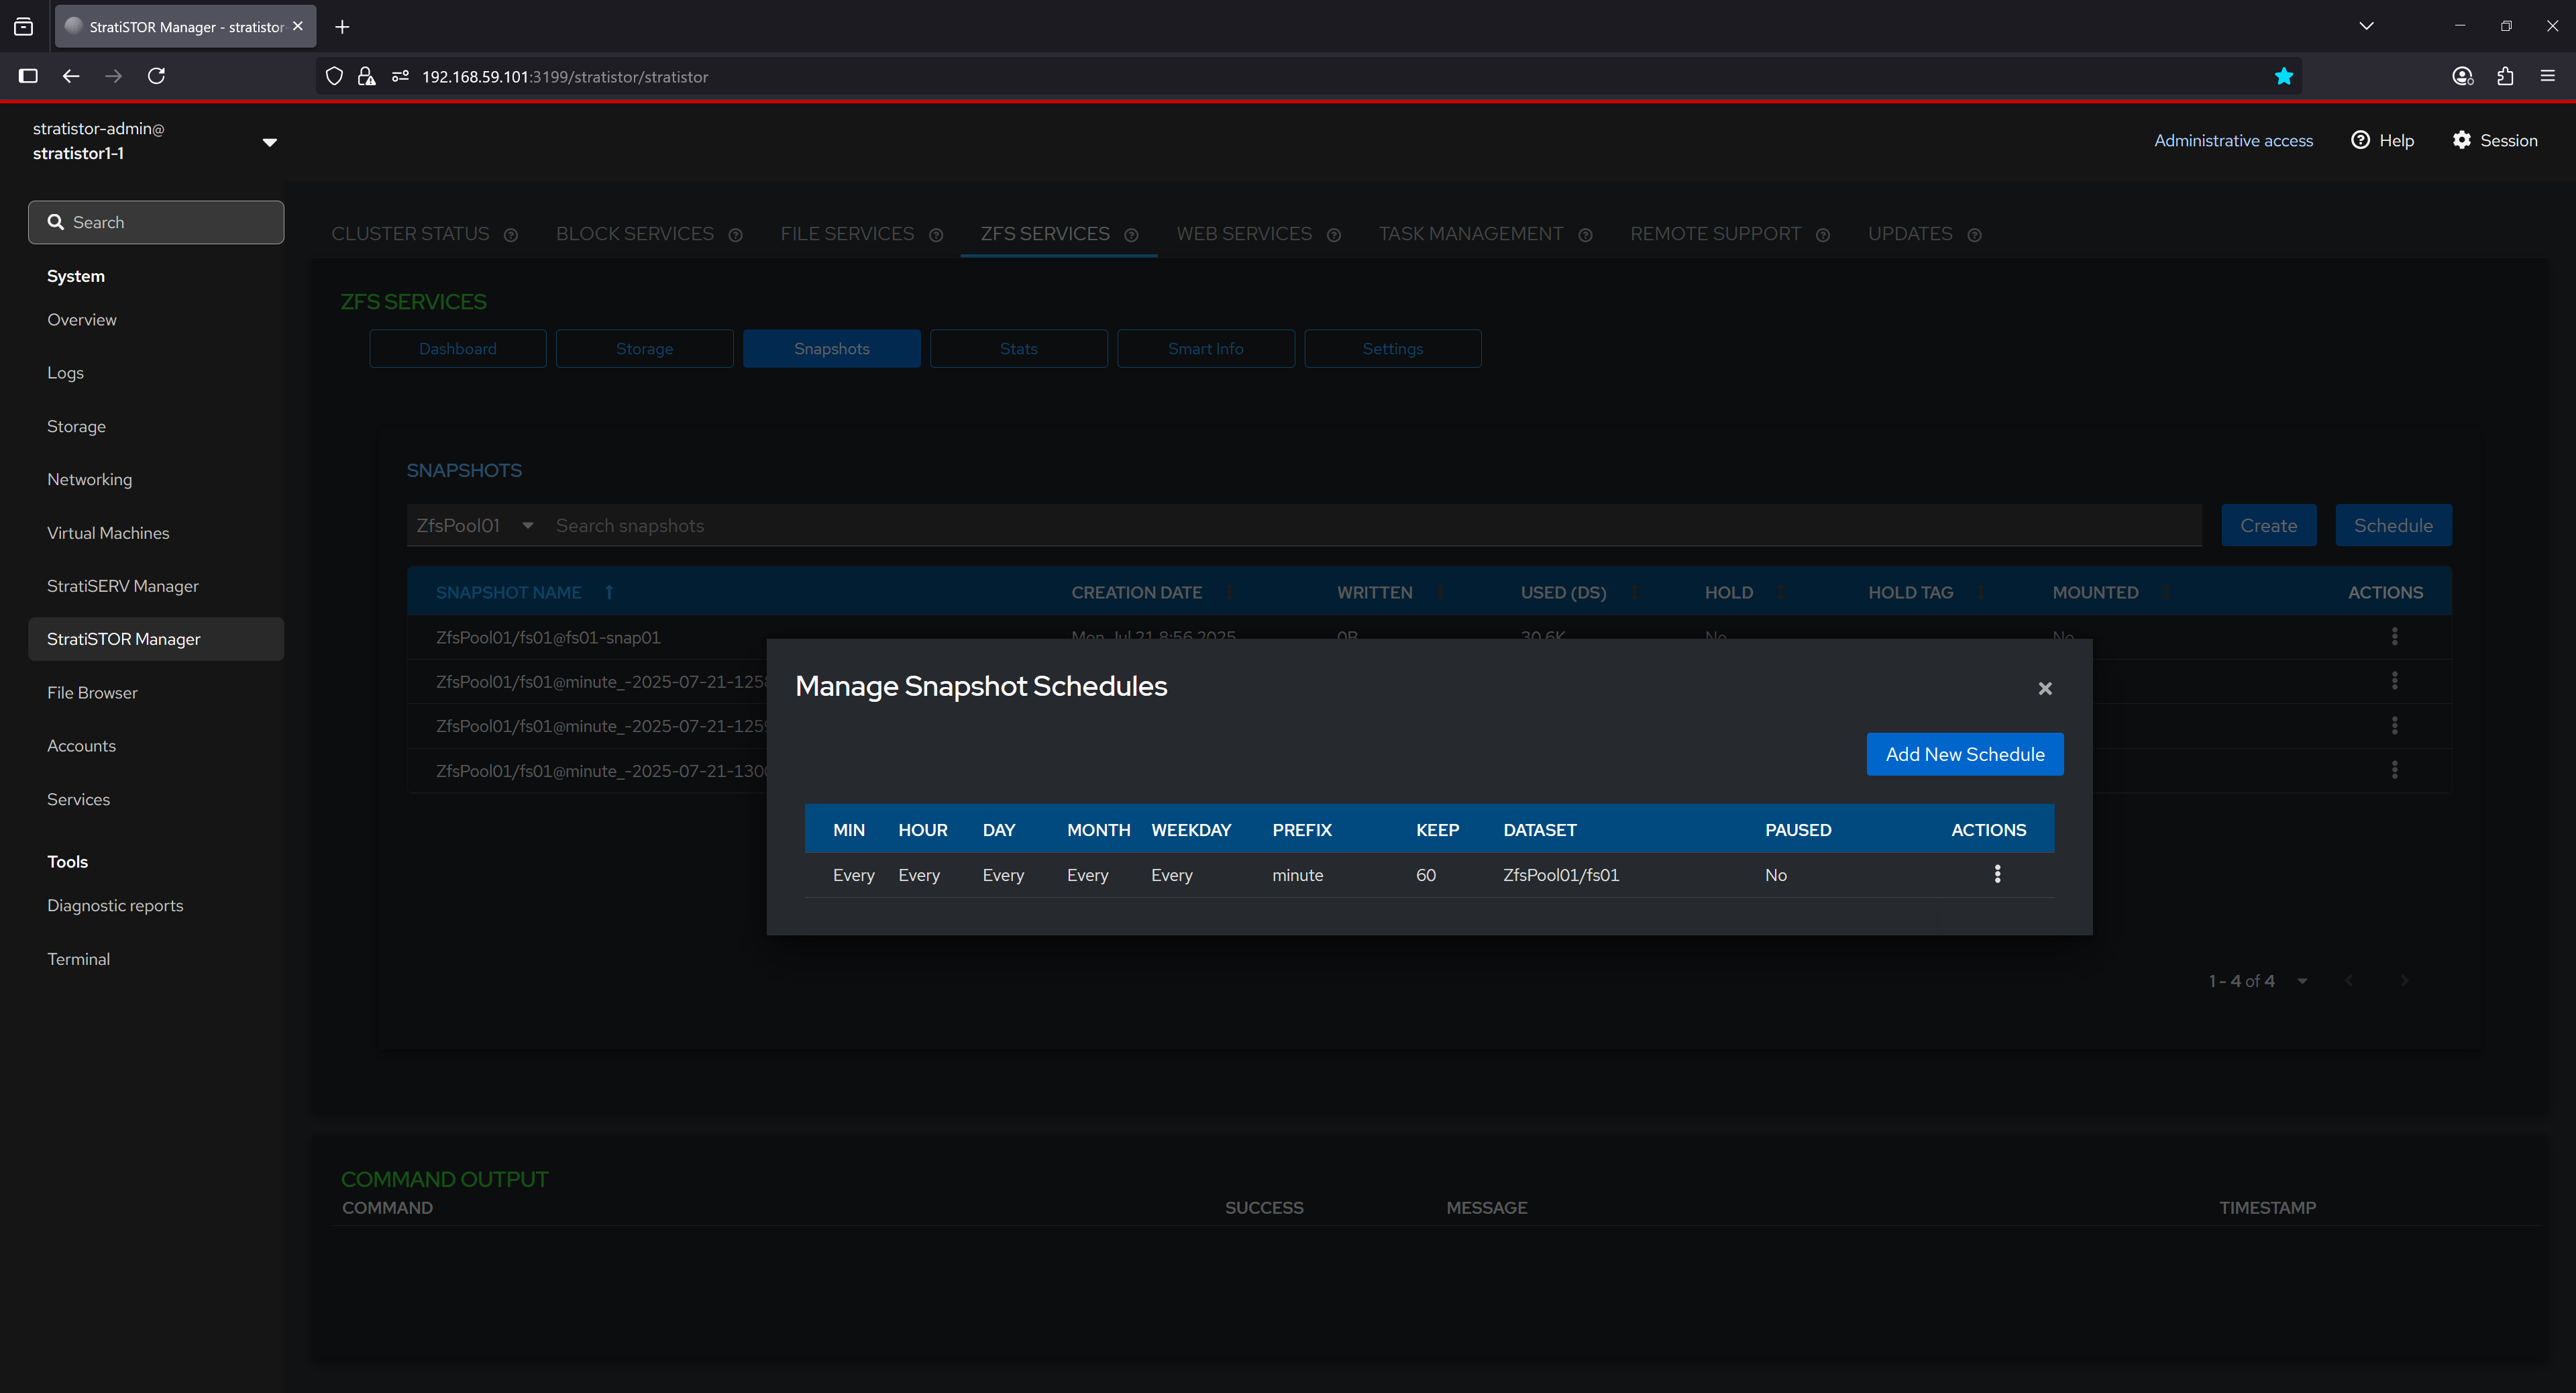
The “New Snapshot Schedule” dialog allows users to define a custom recurring snapshot task for a specific dataset. Users can select snapshot intervals, such as every 15 minutes, set retention limits to control snapshot accumulation, and define a naming prefix for organizational clarity. This configuration ensures that snapshots are created and retained according to predefined policies, facilitating robust data protection and recovery strategies.
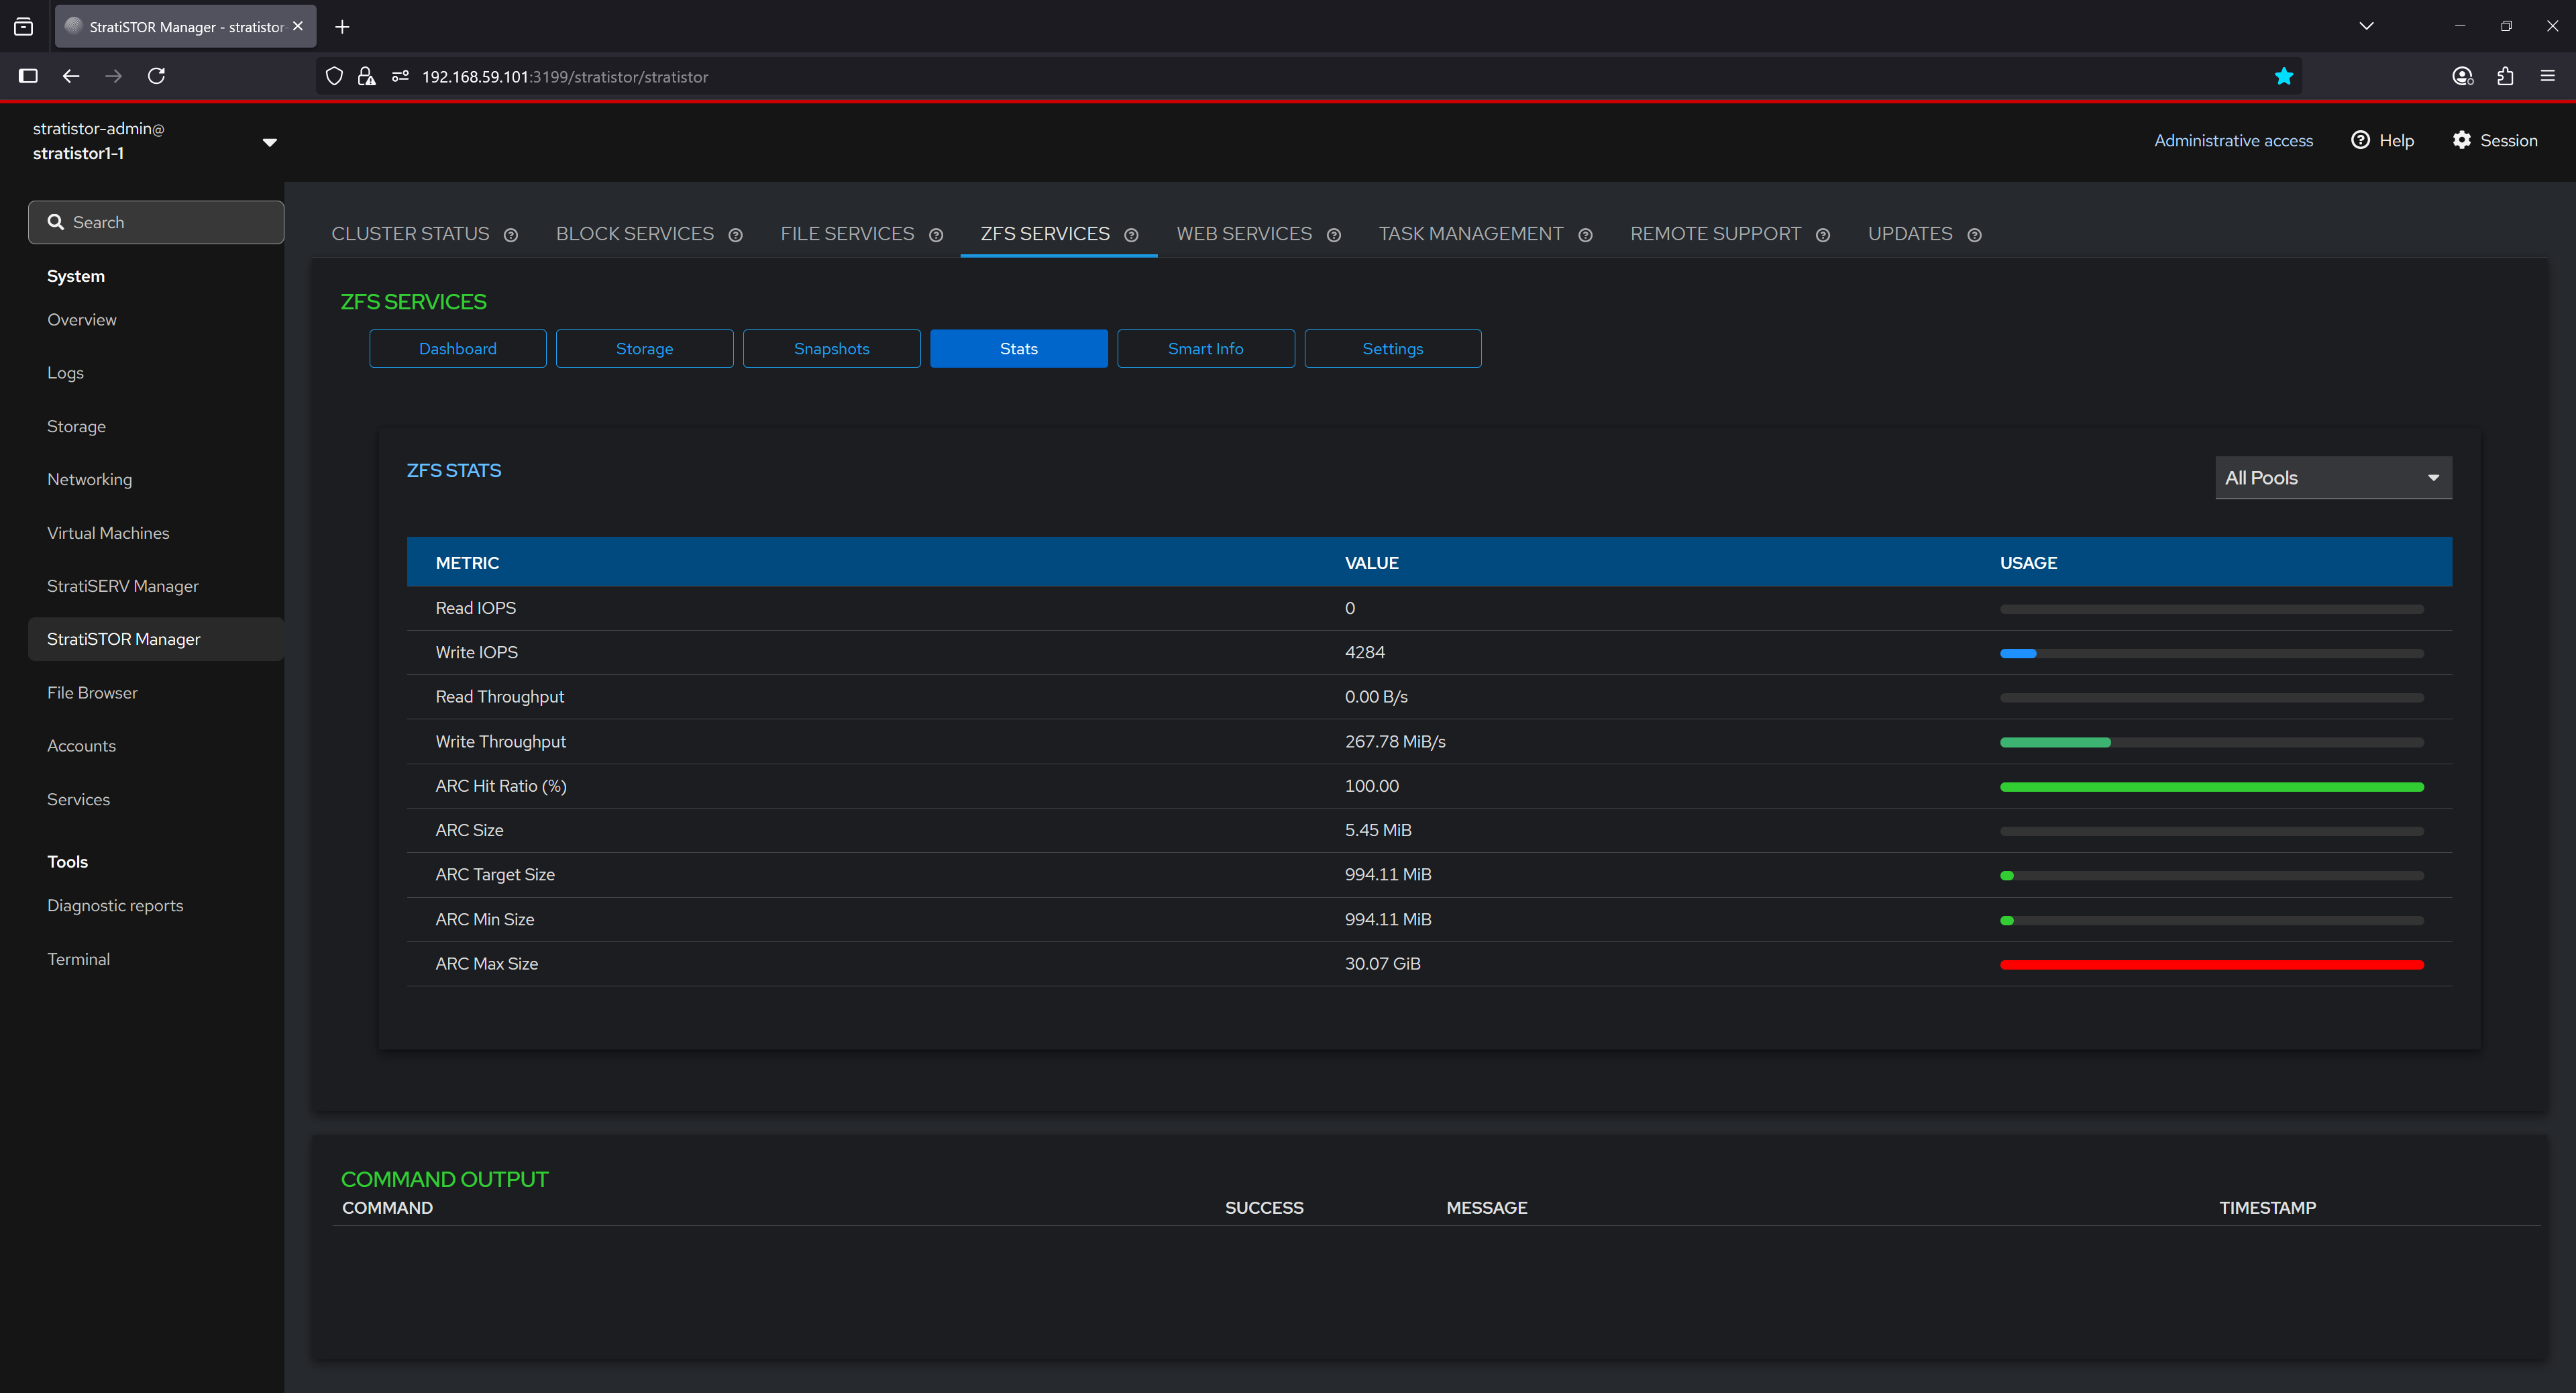
¶ ZFS SERVICES - STATISTICS
The Stats section presents real-time ZFS performance metrics, offering insight into read/write IOPS, throughput, and ARC (Adaptive Replacement Cache) behavior. Metrics such as ARC hit ratio, ARC size, and configured limits are displayed both as numerical values and graphical bars, helping users evaluate system performance and identify bottlenecks or inefficiencies in caching and disk operations.
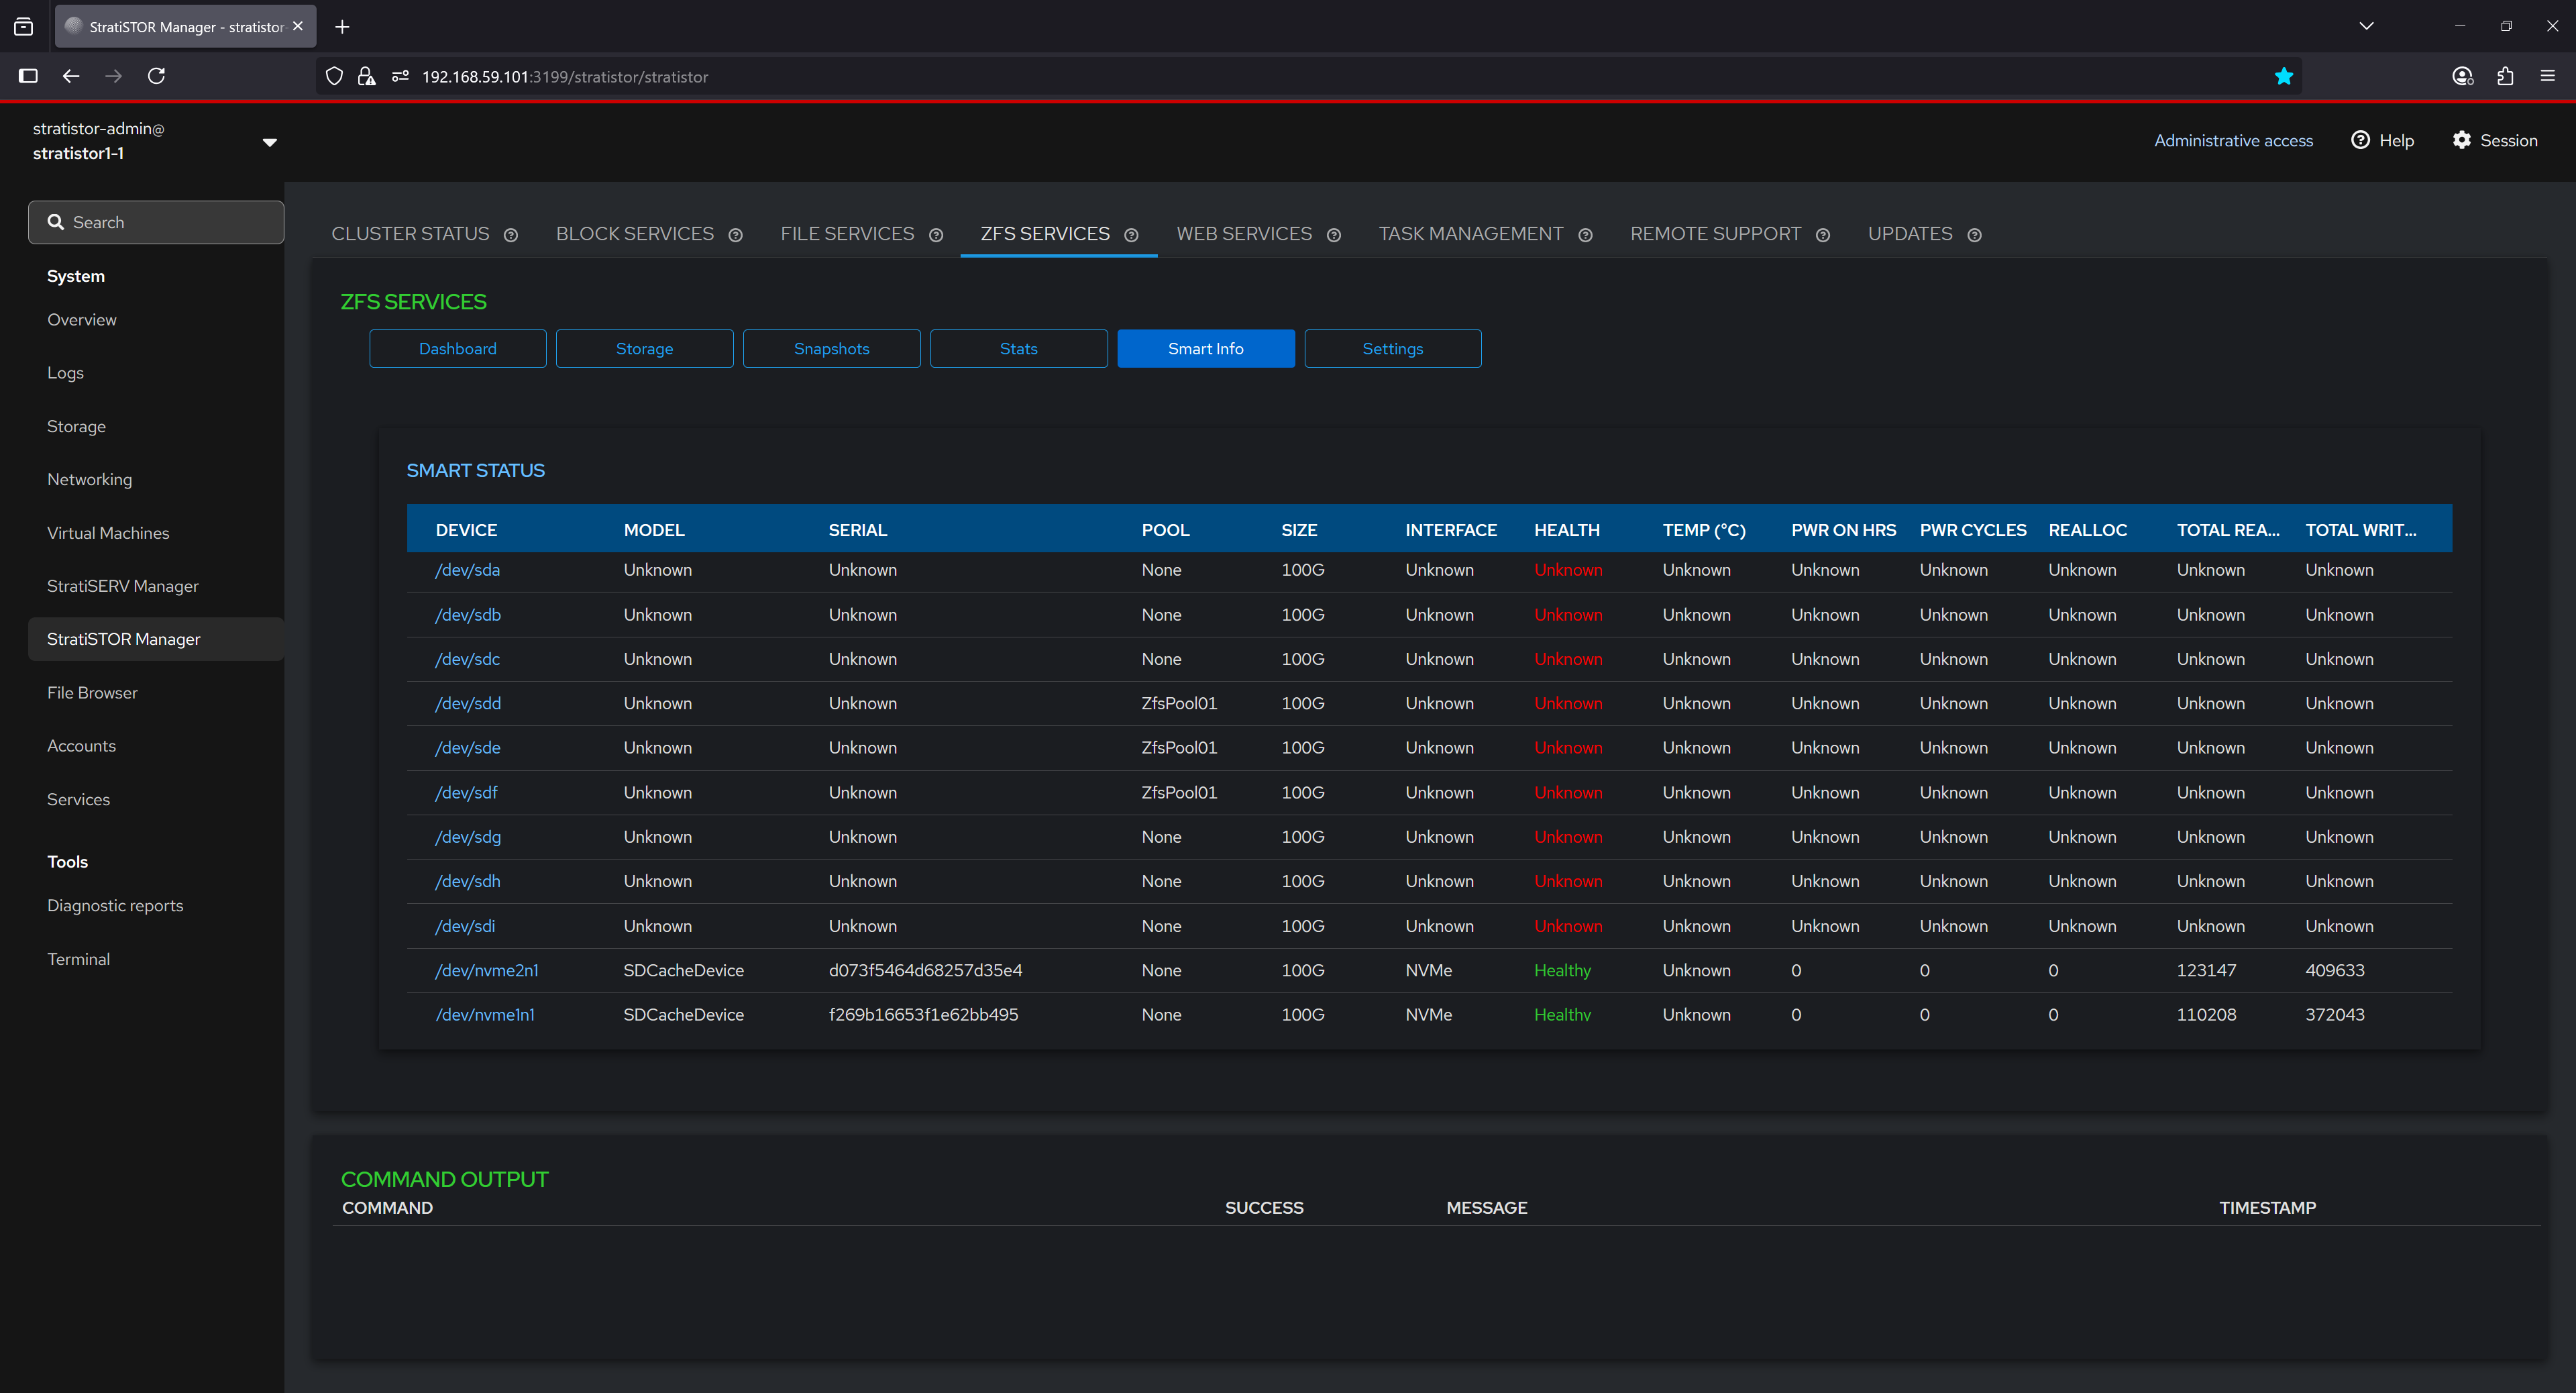
¶ ZFS SERVICES - SMART INFO
The Smart Info tab provides an overview of hardware health data collected from connected block devices. Each device is listed with its model, serial number, pool association, interface type, and SMART attributes such as health status, temperature, and error counts. In this example, most traditional devices show unknown SMART data, while NVMe-based SDCache devices report health as "Healthy" with active SMART statistics. This information is critical for identifying failing drives before data loss occurs.
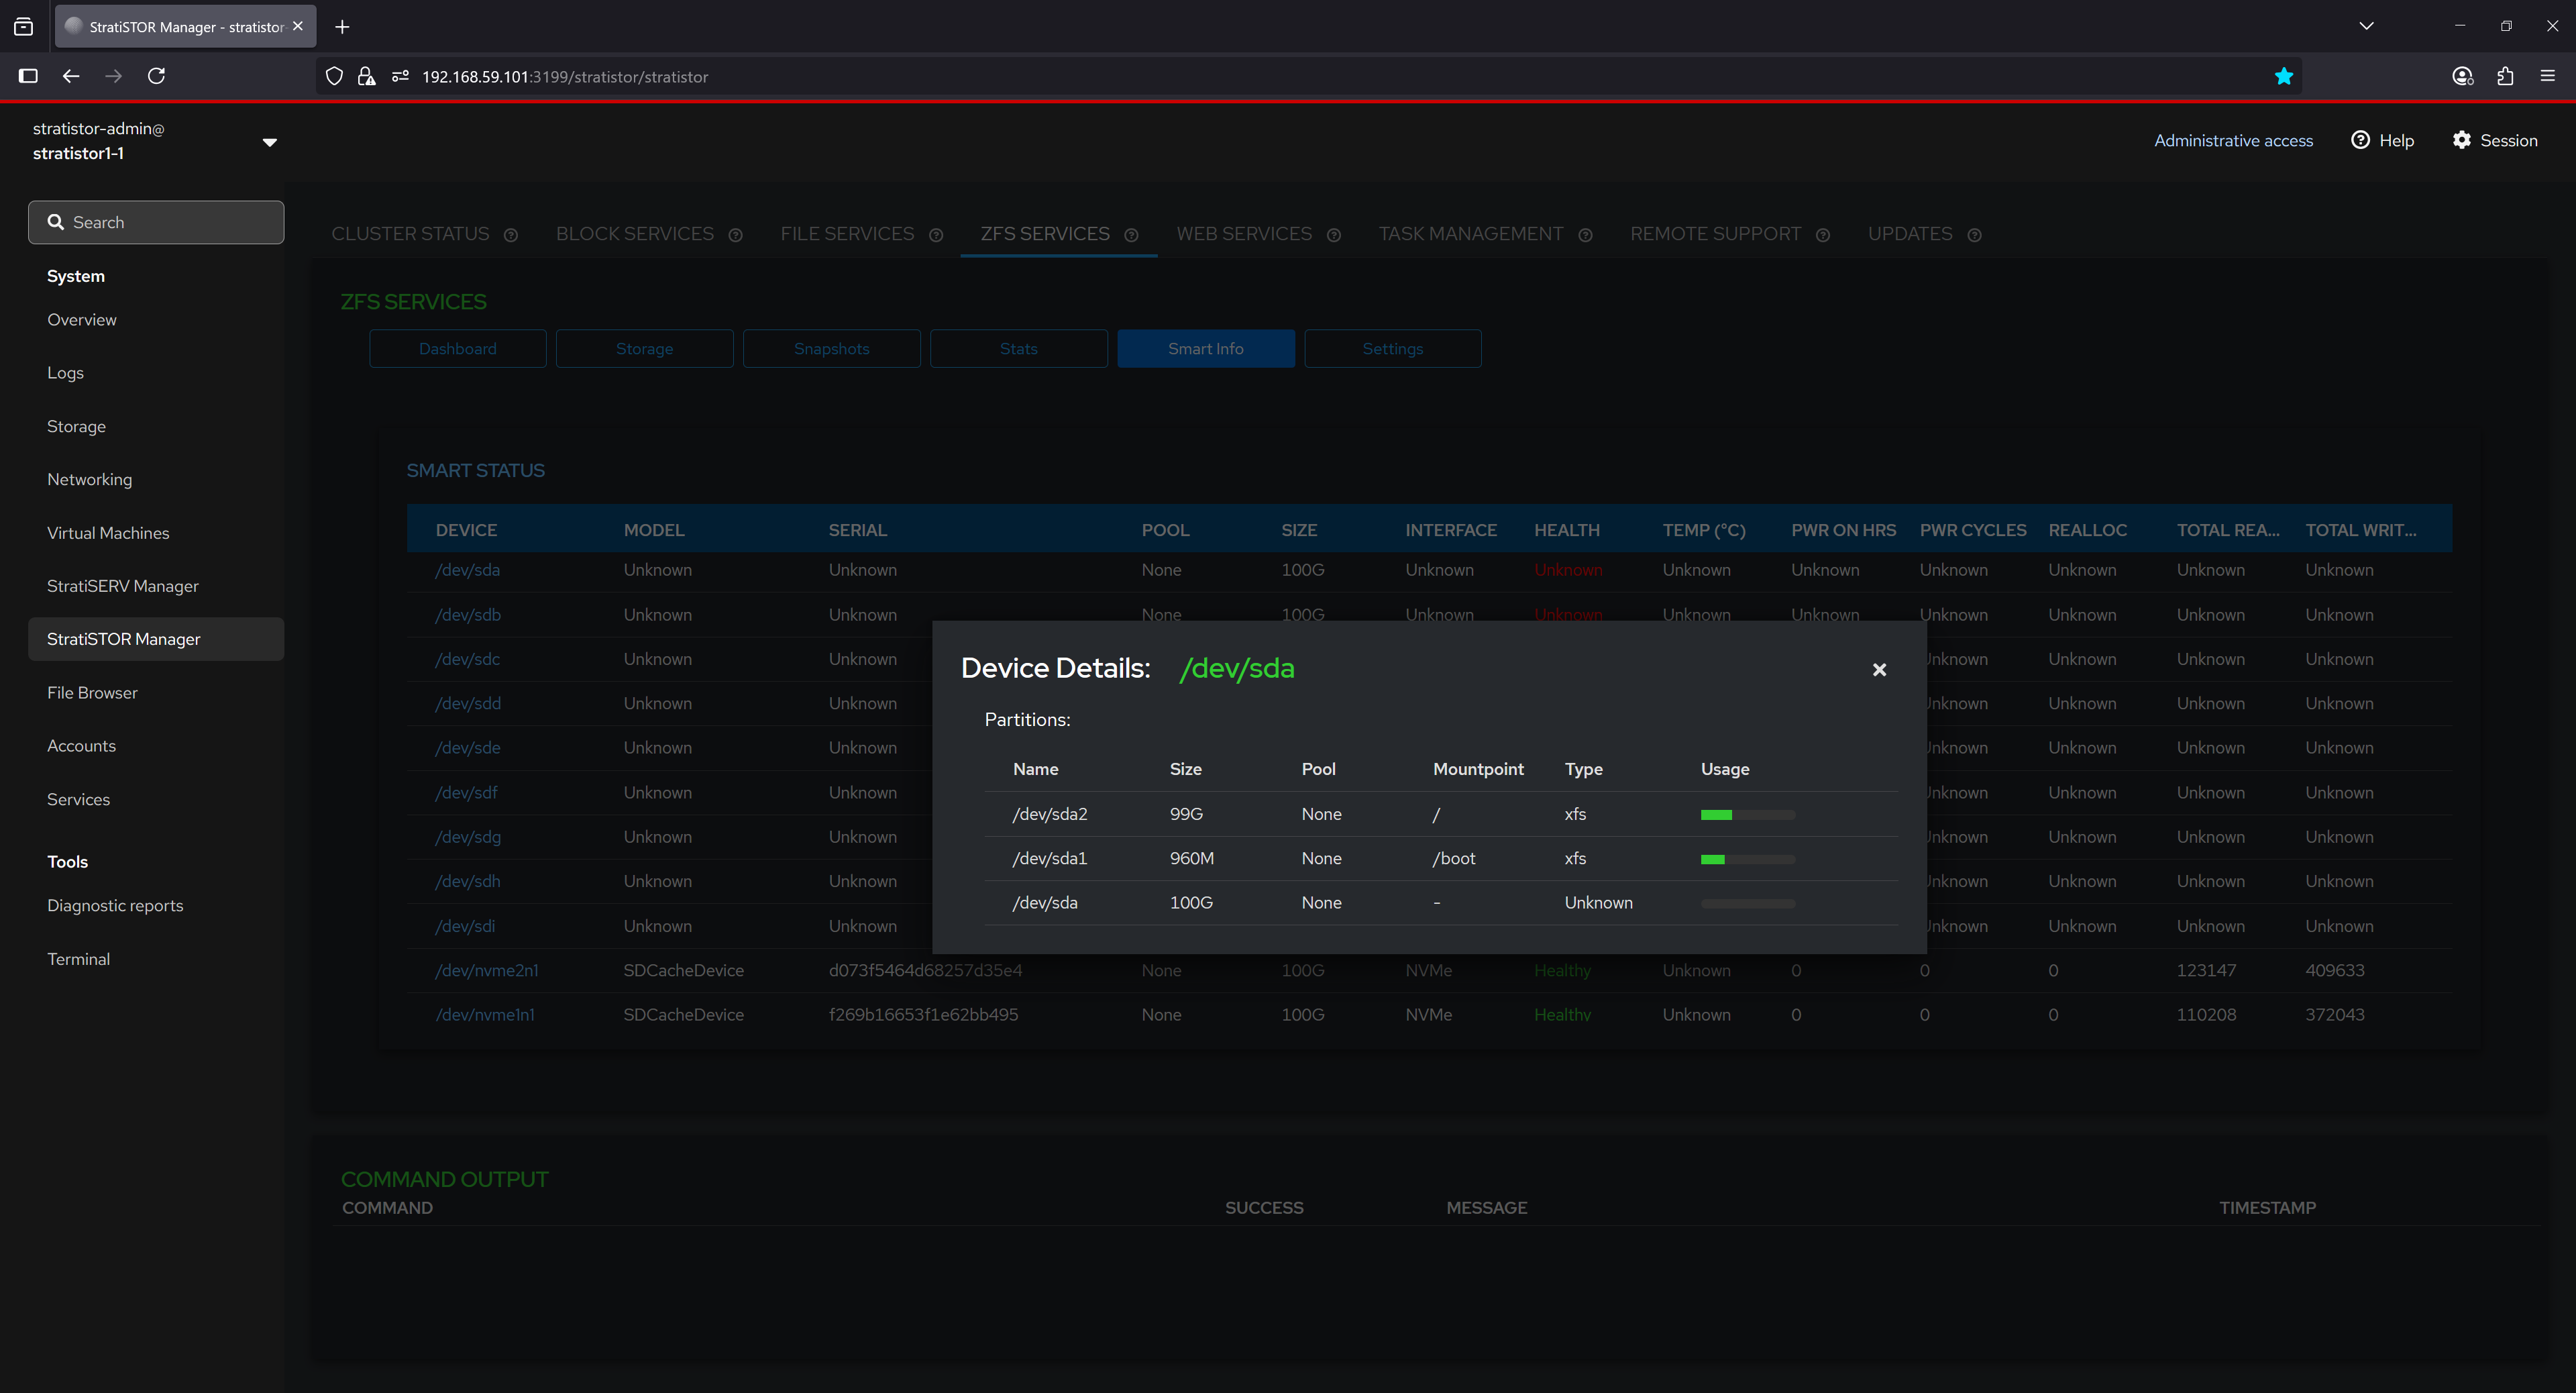
By selecting a device from the SMART Info list, users can view partition-level details including partition names, sizes, mount points, filesystem types, and usage levels. This enables a deeper understanding of how each physical device is partitioned and utilized by the system, and can assist in tasks such as troubleshooting or planning storage layout changes.
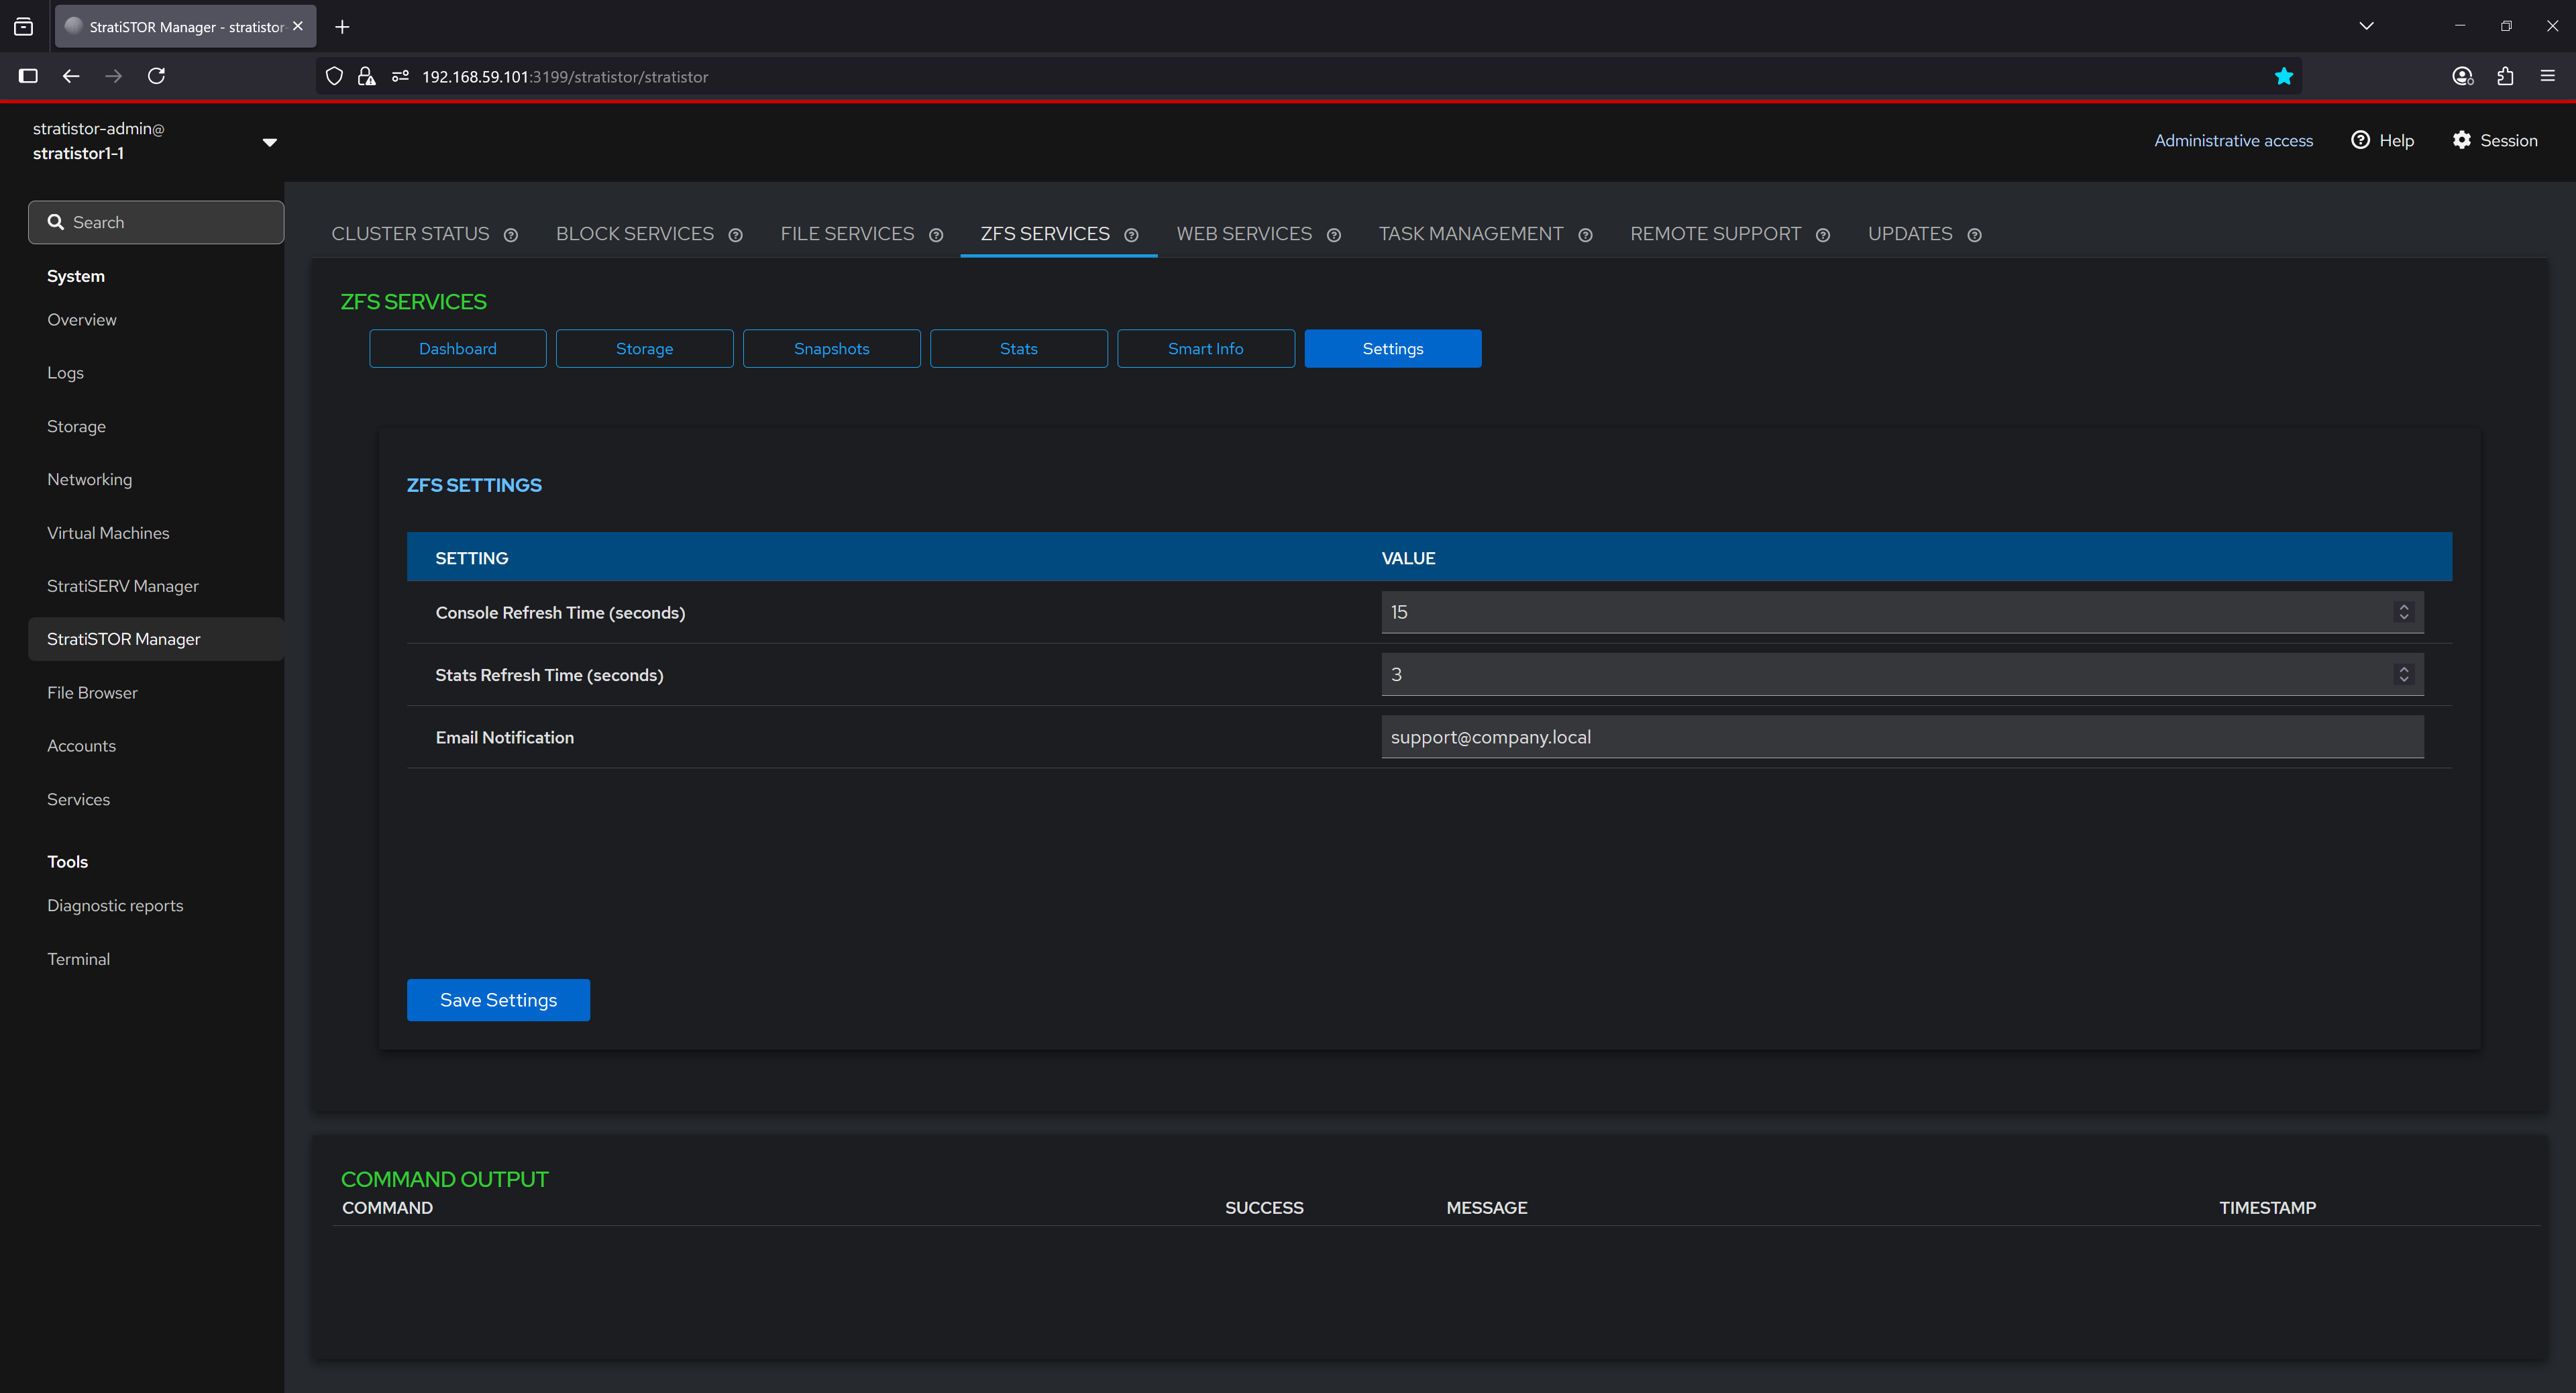
¶ ZFS SERVICES - SETTINGS
The Settings section allows configuration of global ZFS management behavior. Users can adjust the console refresh interval, statistics polling frequency, and specify an email address for system-generated notifications. These settings provide control over how frequently information is updated in the UI and how administrators are alerted to important ZFS events or conditions.
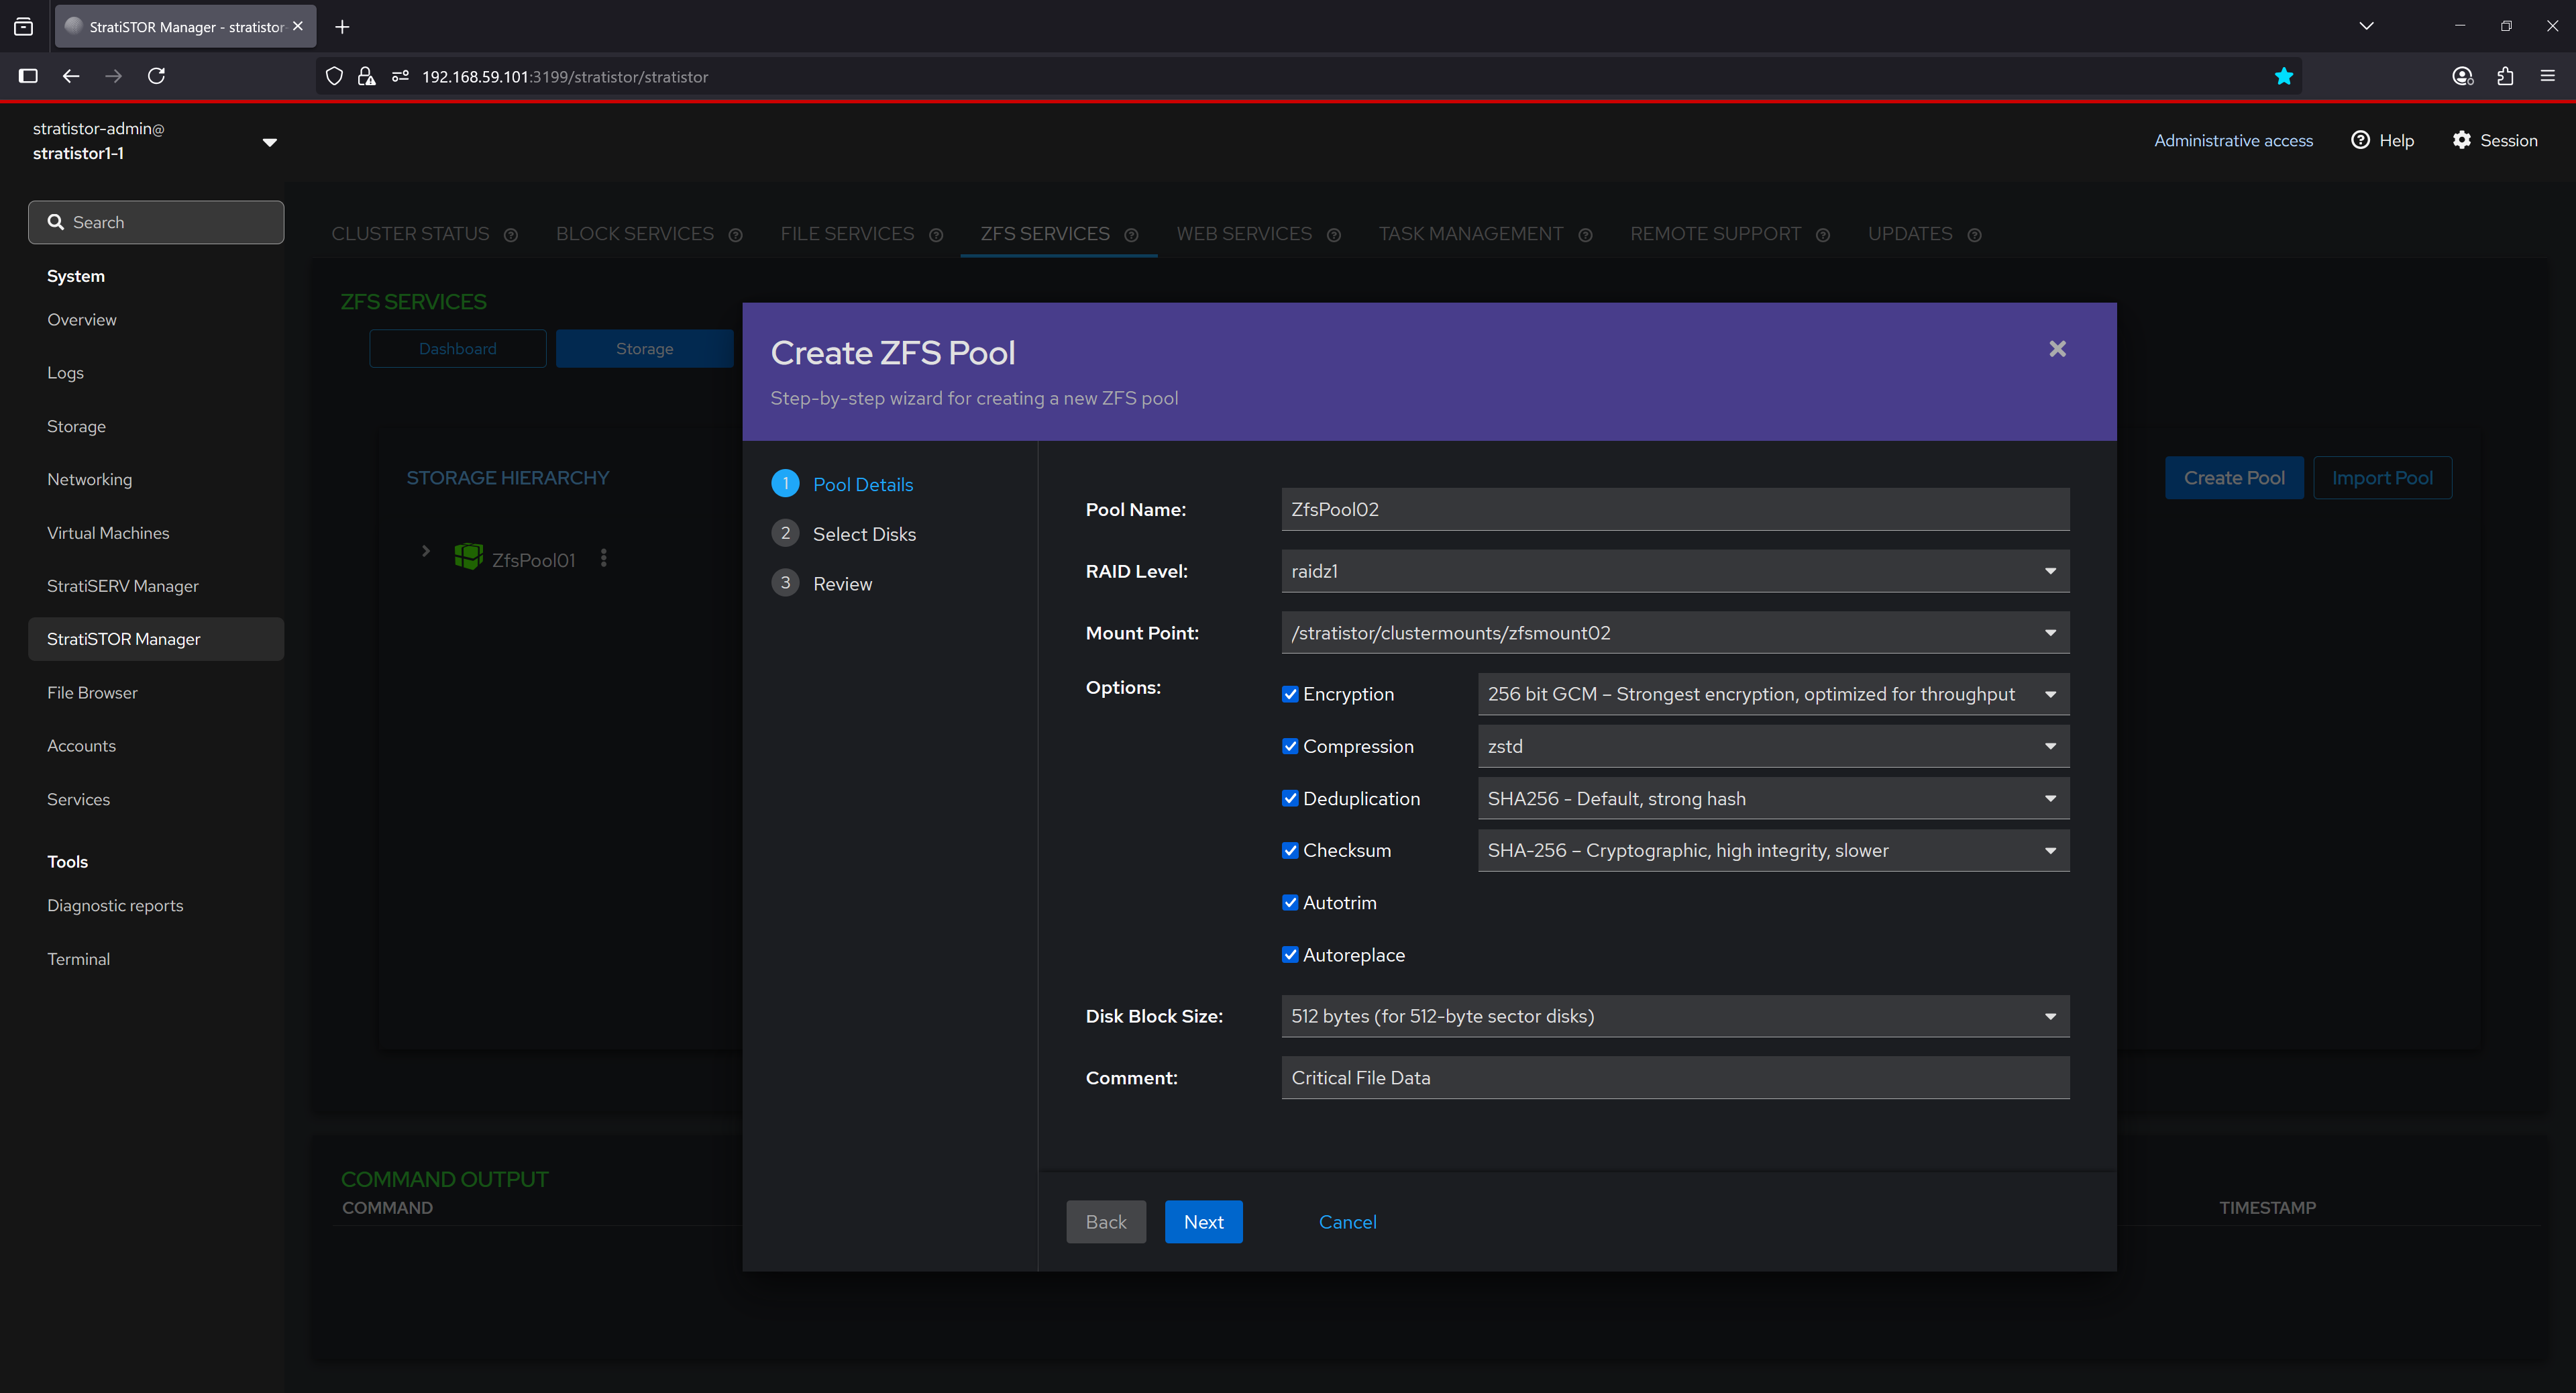
¶ ZFS SERVICES - NEW POOL WIZARD
The pool creation wizard guides users through defining a new ZFS pool. Users can specify the pool name, select the RAID level (e.g., RAIDZ1), define a mount point, and choose advanced options including encryption type, compression algorithm, deduplication hash, checksum method, and block size. Additional comments can be added for documentation purposes. This tool simplifies the process of building secure, high-performance ZFS pools tailored to specific workload needs.
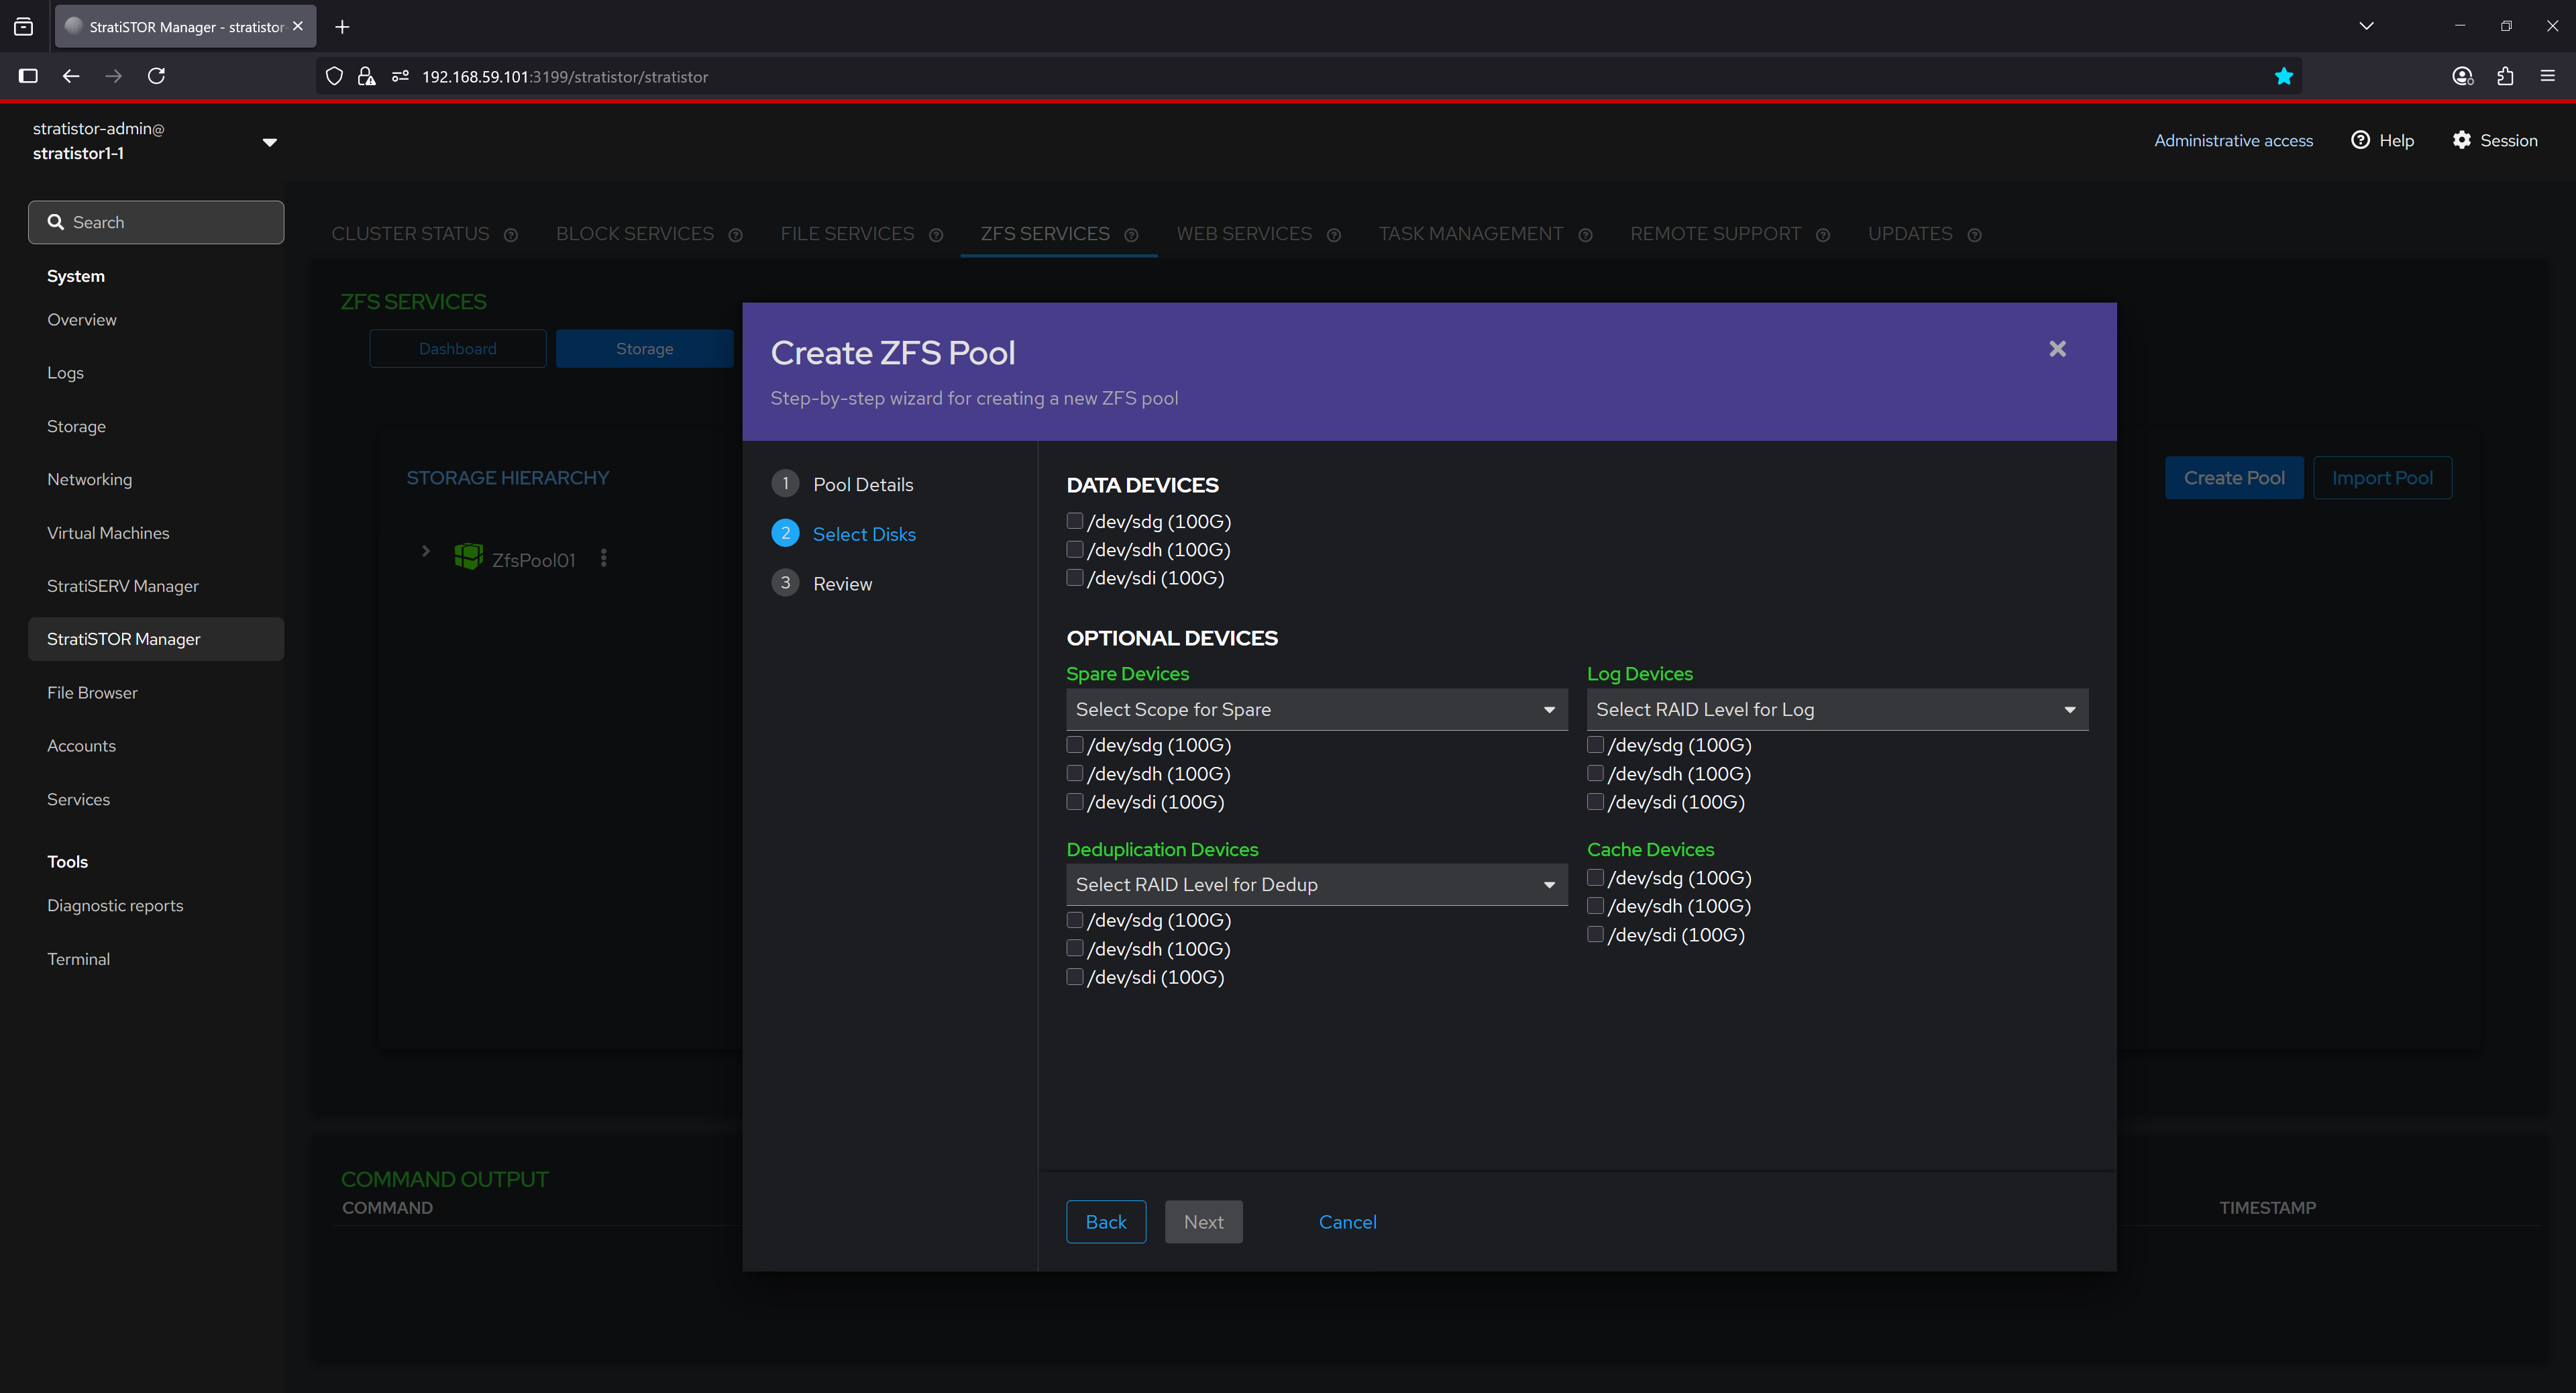
The second step in the ZFS Pool Creation wizard allows users to select both required and optional devices to be included in the new pool. Users begin by choosing the main data devices, which will form the core of the pool's RAID group based on the selected RAID level (e.g., RAIDZ1, RAIDZ2, etc.). Additionally, users can assign drives to specialized roles under optional device categories, such as:
- Spare Devices, which act as hot spares to automatically replace failed disks.
- Log Devices, used to accelerate synchronous write operations via ZFS Intent Log (ZIL).
- Cache Devices, which extend the ARC (Adaptive Replacement Cache) for improved read performance via L2ARC.
- Deduplication Devices, which store deduplication metadata to improve performance when deduplication is enabled.
Each optional category supports different RAID level scopes where applicable, allowing administrators to tailor the redundancy and performance characteristics of auxiliary storage tiers within the ZFS pool.
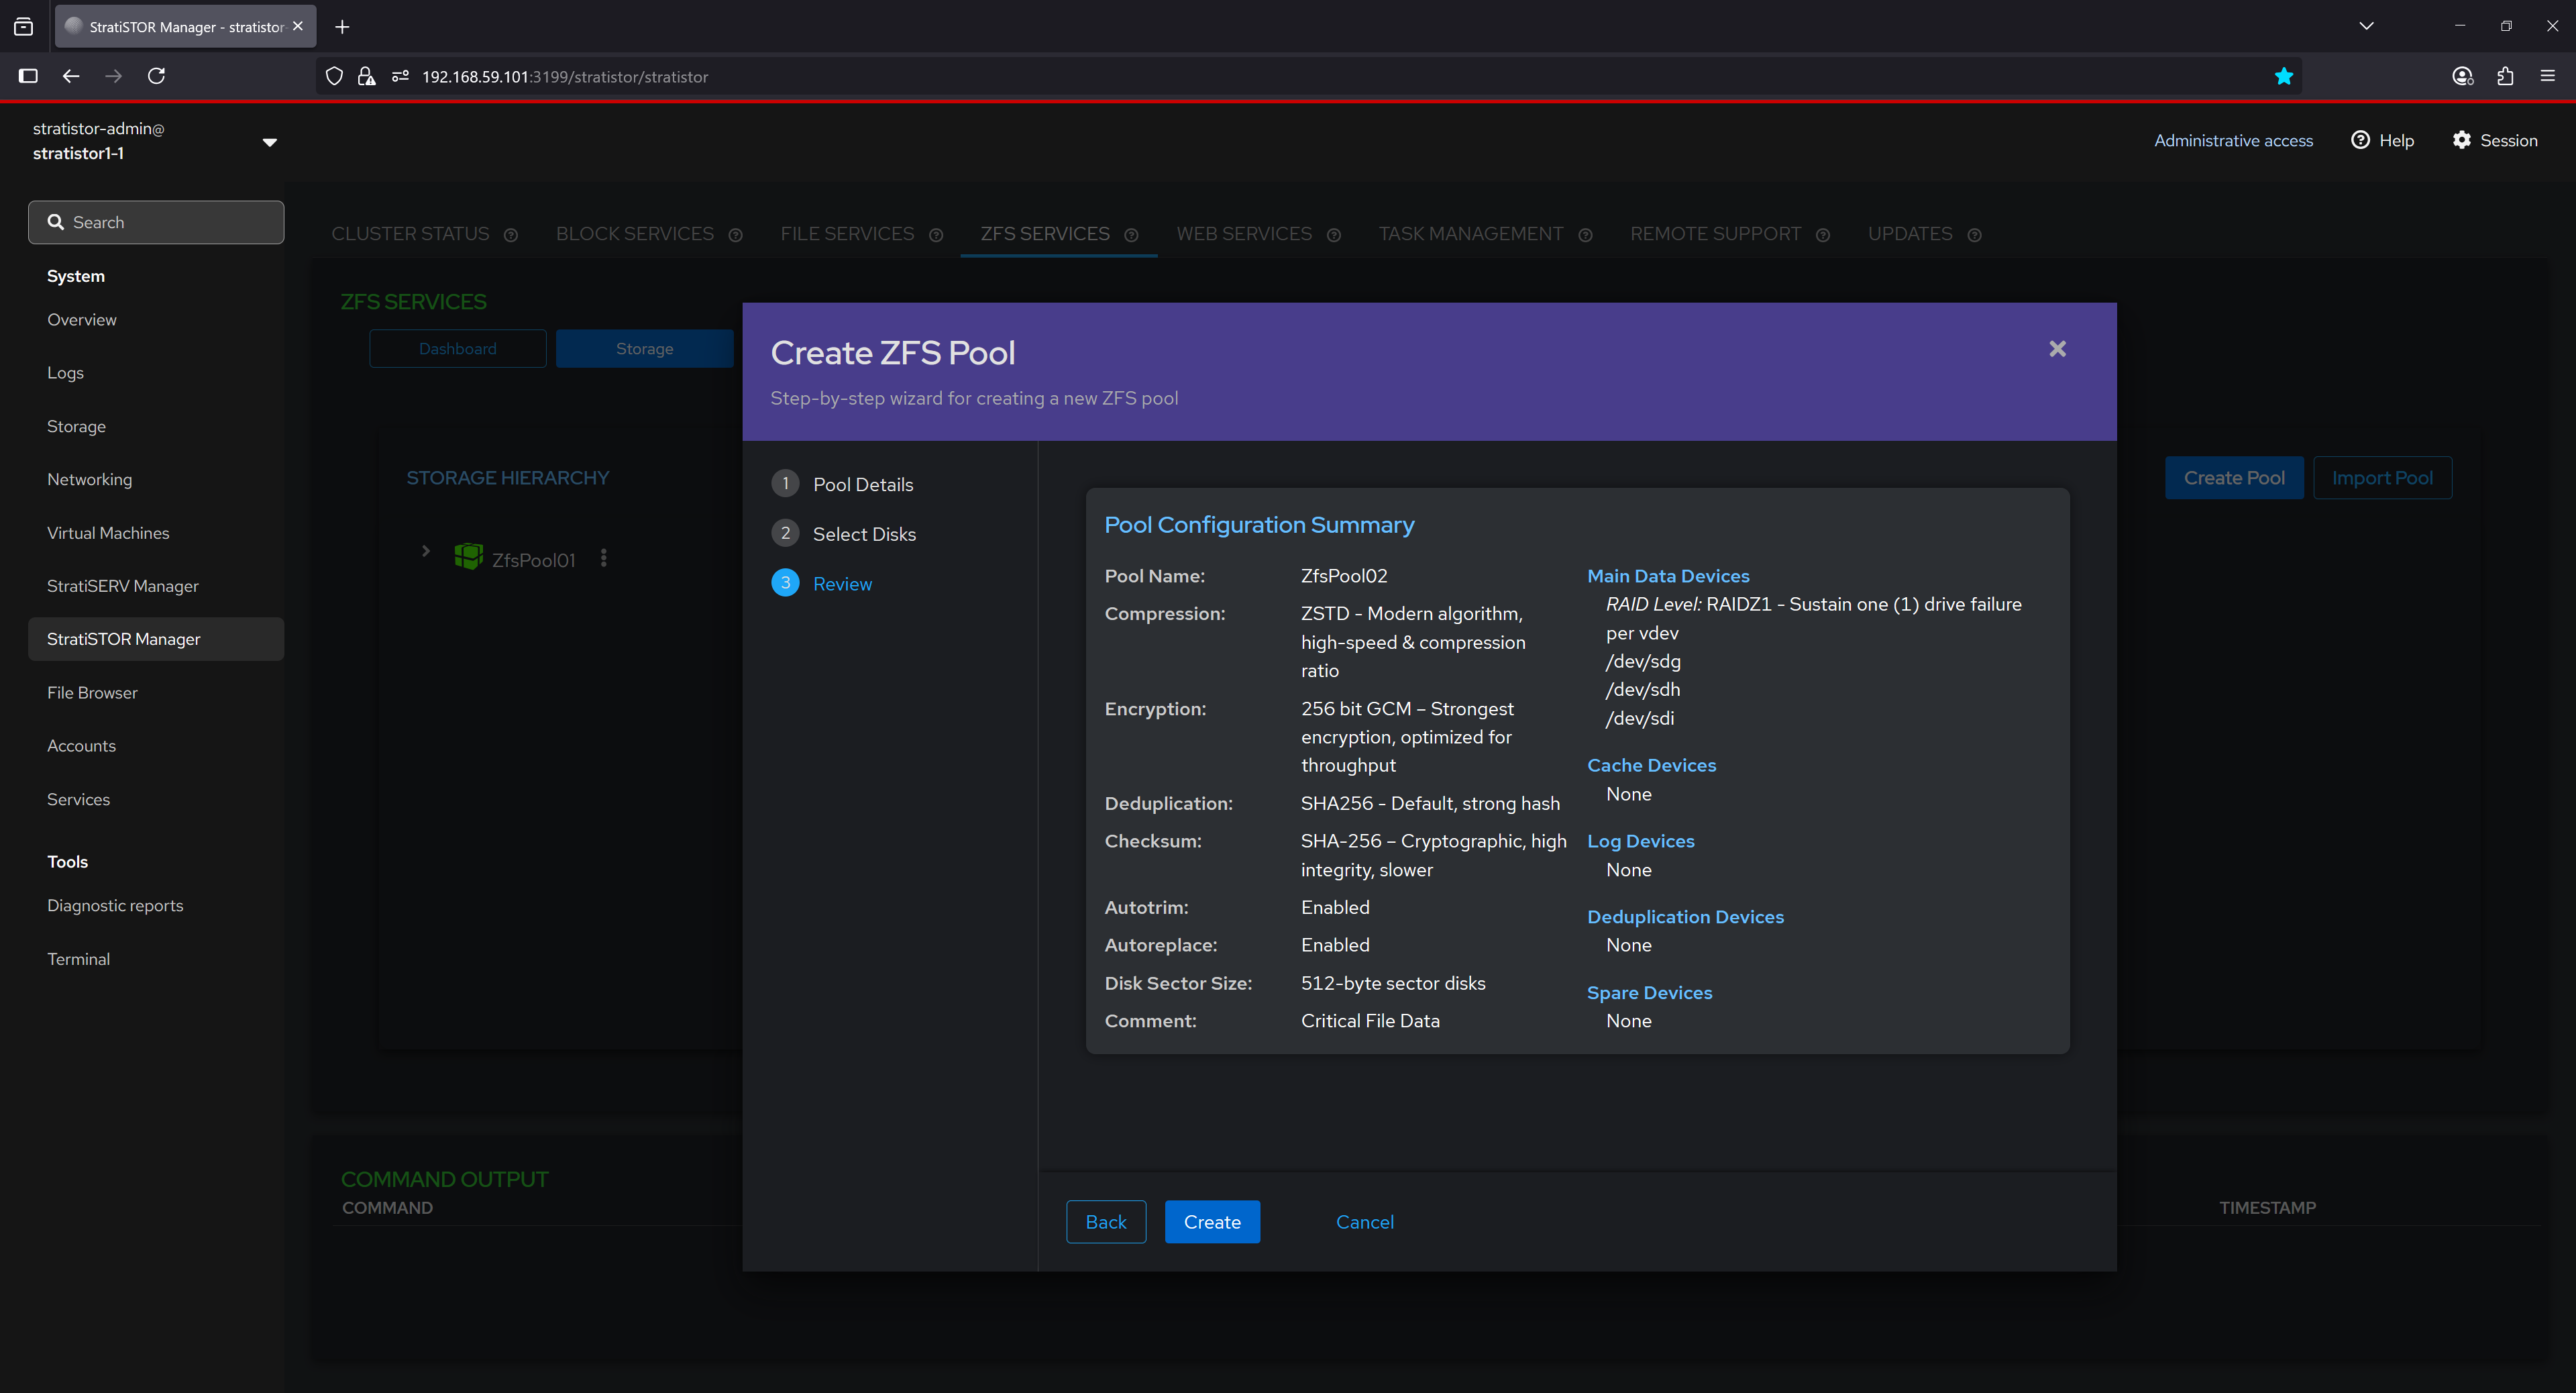
In the final step of the pool creation wizard, a complete summary of the configuration is presented for user confirmation before committing changes. This summary includes:
- Pool Name, compression algorithm (e.g., ZSTD), encryption level (e.g., 256-bit GCM), and deduplication hash (e.g., SHA256).
- Checksum algorithm used for data integrity validation, typically SHA-256 for cryptographic strength.
- Autotrim and Autoreplace settings, which help maintain performance and automate failed disk replacement.
- Disk Block Size and any administrative comments for internal documentation.
The list of main data devices is shown with the corresponding RAID layout (e.g., RAIDZ1 for single disk fault tolerance), followed by any assigned optional devices for cache, logs, deduplication, and spares. This comprehensive overview ensures the user can validate the complete storage layout and protection strategy before the pool is provisioned.
¶ FILE BROWSER
The File Browser view provides a convenient way to access the node and cluster storage resources directly from the web console. The administrator can create files, directories, change permissions, and upload and download files directly through the browser window.

¶ FILE BROWSER - FILE AND DIRECTORY FUNCTIONS
There are several filtering and action buttons available depending on what type of object you are working on within the storage system.

¶ ACCOUNTS
Local cluster node accounts can be created and/or modified from the Accounts view. These accounts are system access accounts (i.e. for access to this web console) and must be performed on each node in the cluster by using the server selector in the upper left-hand corner of the web console.

¶ ACCOUNTS - CREATE NEW ACCOUNT
To create a new account click on the Create New Account button. The administrator can define all the parameters necessary to create the new account such as full name, user name, home directory, shell type, and password.

¶ SERVICES
The Services view provides a real-time status of all services currently running on this cluster node. The services can be filtered using the filter bar.
Service details can be viewed by clicking on any of the services. The full service detail including service state control will be visible to the administrator.

¶ DIAGNOSTICS
System diagnostic reports can be generated at the direction of SteelDome support personnel. The Diagnostic Reports view will show all previous generated reports for this cluster node.
To run a report, click on the Run Report button.

¶ DIAGNOSTICS - RUN NEW REPORT
The Run New Report view will appear. The administrator will need to provide the report label, optional password for encrypting the report, and other report specific options such as obfuscation and verbosity settings.

When ready to run the report, click on the Run Report button. The report will take a few minutes to complete. Once completed this can be downloaded and provided to SteelDome personnel, or the support personnel can access the report via the remote support service.
¶ TERMINAL ACCESS
The Terminal view provides administrators with terminal access to the local cluster node. This is equivalent to SSH access but through the web browser window without the need for SSH terminal software.

Terminal access can provide more detailed access to underlying system functions and should only be used under direction of SteelDome support personnel.
¶ MANAGEMENT CONSOLES
For reference, all interfaces are embedded within the main StratiSYSTEM administration console, but if direct access is required, they can be accessed as follows:
- StratiSTOR / StratiSERV Administration
- https://stratistor1-1:3199
- stratistor-admin / SteelDome (or as defined in current_deployment.json)
- https://stratiserv1-1:3199
- stratiserv-admin / SteelDome (or as defined in current_deployment.json)
- StratiSTOR Storage Administration
- https://stratistor1-1:3198
- admin / SteelDome (or as in current_deployment.json)
- StratiSTOR / StratiSERV VM Administration (if enabled)
- https://stratistor1-1:3199/stratiserv/stratiserv
- stratistor-admin / SteelDome (or as defined in current_deployment.json)
- https://stratiserv1-1:3199/stratiserv/stratiserv
- stratiserv-admin / SteelDome (or as in current_deployment.json)
- StratiSTOR Container Administration (if enabled)
- https://stratistor1-1:3197
- Set at initial login (must be done within two minutes of activation)
- StratiSTOR Monitoring
- https://stratistor1-1:30443
- Admin / SteelDome
- StratiSTOR Global Scheduler
- https://stratistor1-1:3013
- admin / admin
- StratiSTOR VDI Administration (if enabled)
- https://stratistor1-1:12443
- Admin / SteelDome (or as defined in current_deployment.json)